Bringing data to life: using graph technology for knowledge graph visualization
As companies accumulate more data in their data lakes and warehouses, utilizing it effectively for informed decision-making becomes increasingly challenging. It's not enough to simply store data - a system that can guide decisions in the right direction is essential. But making sense of diverse and siloed data can be daunting. Without the right tools and methods, countless business insights and opportunities may be lost because of the inability to untangle this intricate web of disconnected data.
Enter knowledge graphs. By leveraging graph technology for knowledge graph visualization and analysis, you can unlock a world of possibilities and insights. Graphs make it easy to explore and understand complex datasets in an intuitive way, helping organizations make smarter decisions and build smarter applications. In this article we’ll look at how graph databases and graph visualization can transform the way organizations access and gain actionable insights from their data.
Using graph technology for your knowledge graphs
Semantic metadata creates a layer of interconnectedness over your data, providing a unified and consistent view of its context. This approach transforms fragmented knowledge from various systems into an interlinked knowledge graph. At their core, knowledge graphs are graphical representations that showcase entities, their attributes, and the relationships between them.
The key is not only to gather and store data but also to use a system adept at connecting data points, revealing how the entire business system is interconnected, and most importantly, drawing meaningful conclusions. Graph databases are the technology most capable of drawing connections within dispersed data to generate new knowledge.
While it's possible to connect data in other databases and systems, these approaches often fall short when it comes to uncovering new insights, determining data causality, and making predictions, mainly because of performance issues related to real-time data manipulation and updates.
Simply connecting data just won’t cut it if the resulting information becomes outdated before it can be used. Graph databases excel at exploring connections and inferring new ones in real-time, dynamically, and without the hassle of joining multiple tables and spending hours calculating valuable results. And graph visualization helps users gain deeper understanding and a comprehensive view of the complex connections within the data.
Graph databases: delivering high performance for knowledge graph analysis
While relational databases can identify connections between data, their performance limitations make graph databases a more advantageous choice for businesses. There are many important applications for knowledge graphs, including, for example:
- Data governance
- Biomedical research
- Supply chain
- Fraud detection
- Cybersecurity
- Recommendation engines
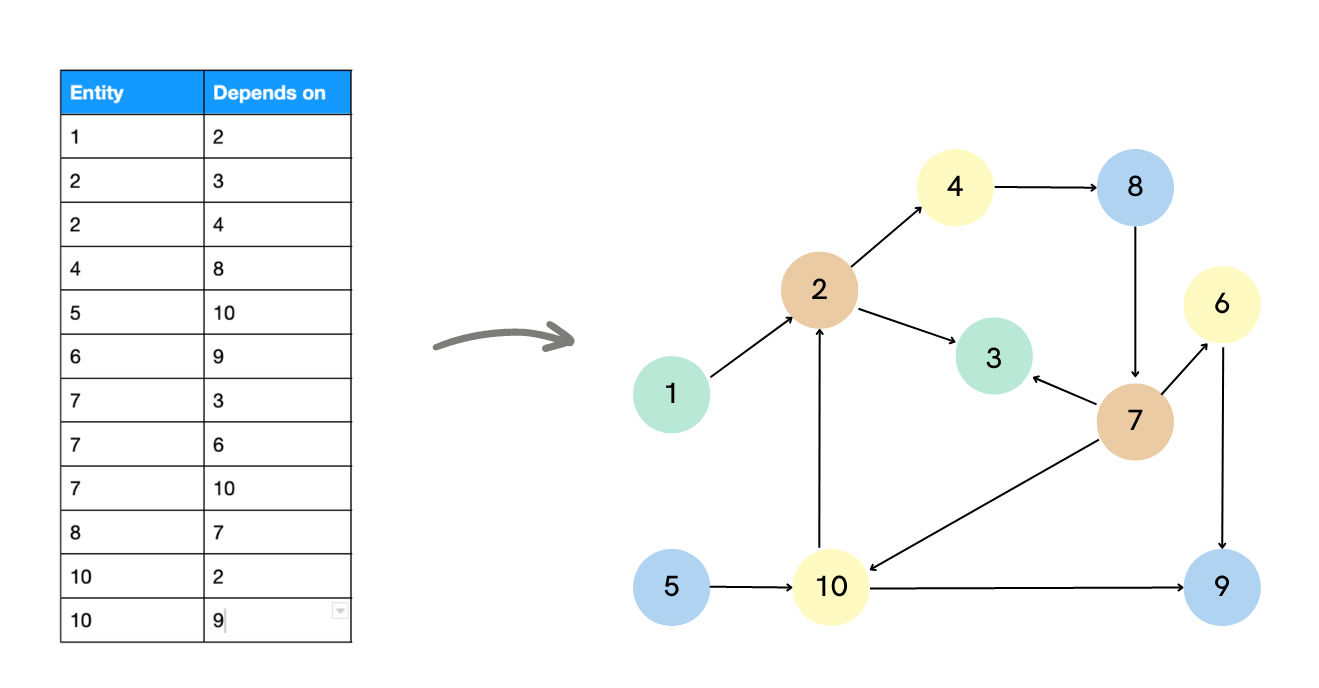
Let’s consider a supply chain scenario where you need to examine how a single change impacts the rest of the network. In a relational database, the impact is stored within a table, with dependencies captured in rows.
As an example, car manufacturers must be aware of and analyze such dependencies. How would a missing car part impact the overall business? Given that a single automobile requires tens of thousands of parts for assembly, supply chain disruptions – caused by geopolitical events, pandemics, etc. – can significantly impact operations.
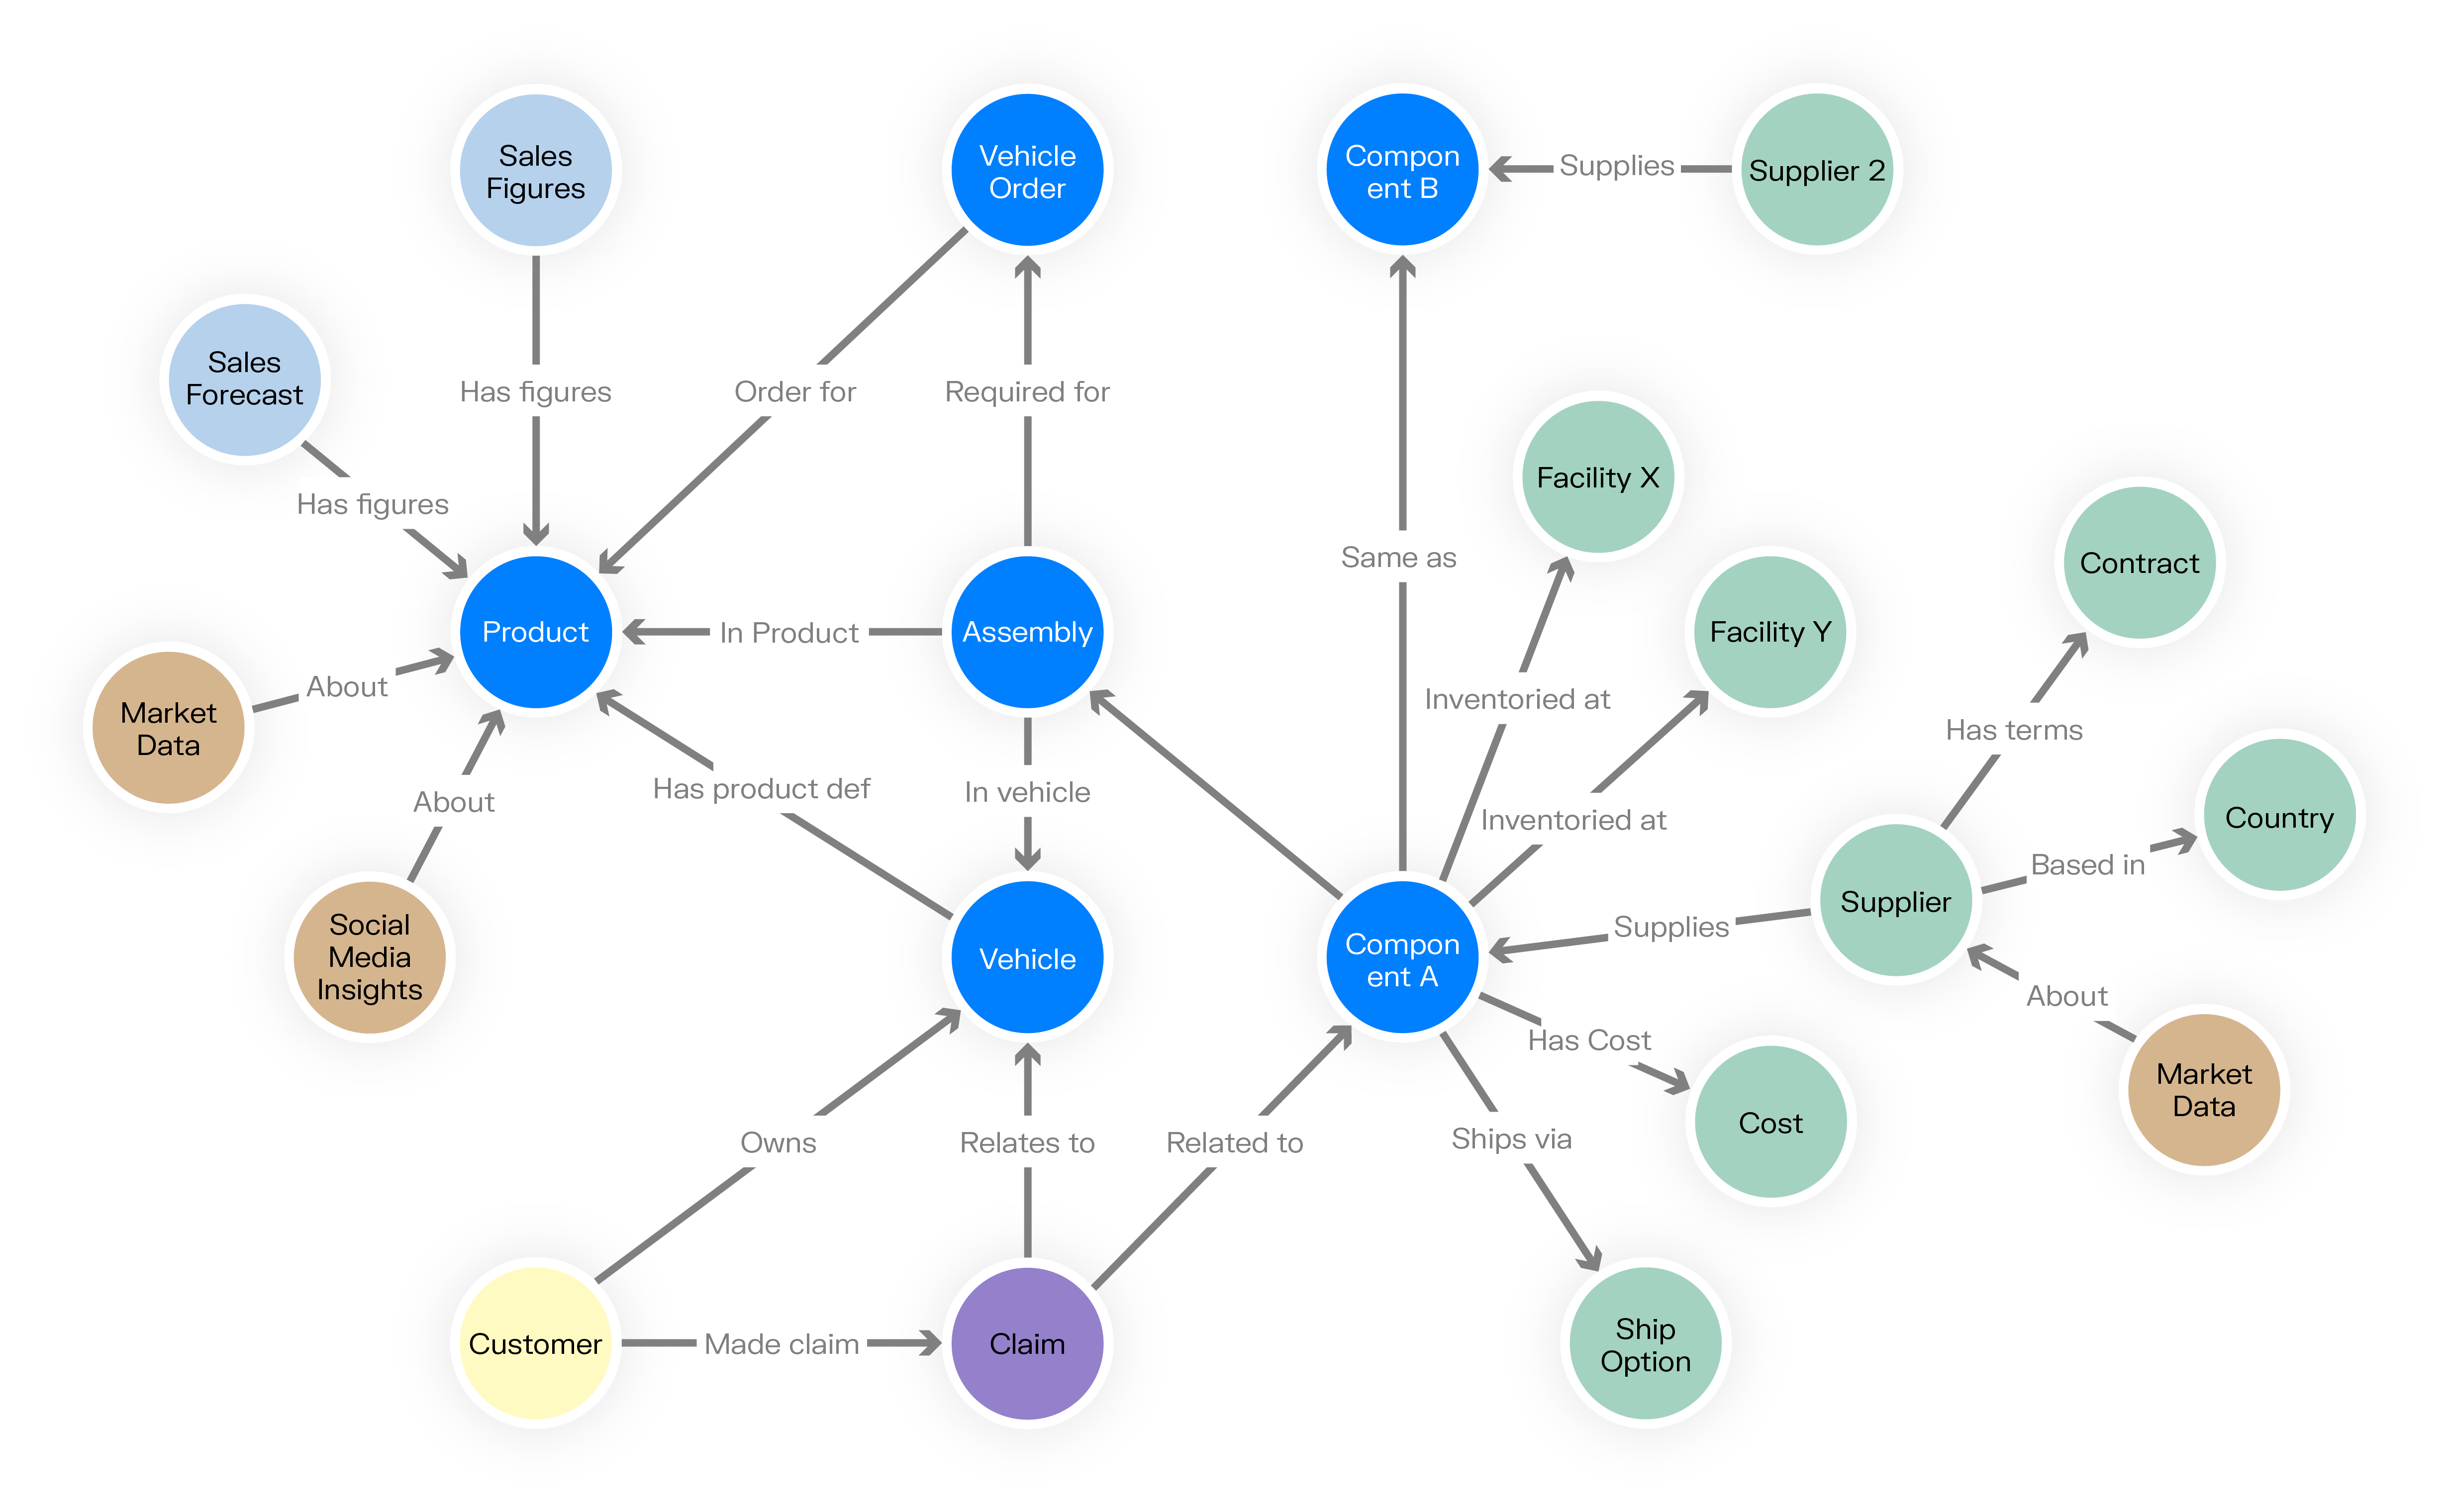
Say a key part is unavailable from the usual supplier. An alternative provider may be able to deliver it. While you could potentially resolve this issue with a CSV file, Google search, and a phone call, what happens if the new supplier's part isn't an exact match, and installing a slightly different component affects 15 other parts, which in turn impact other parts of the supply chain? Addressing this challenge using manual methods or a relational database would be both difficult and time-consuming. However, with graph databases, resolving such dependencies becomes a breeze. Moreover, knowledge graphs add an extra layer of semantic meaning, enabling software to comprehend the interconnected data and derive new conclusions and insights.

Combining knowledge graphs with graph technology offers numerous benefits, such as easy exploration of data through index-free adjacency, adaptability to changing models, and enhanced scalability.
Understanding knowledge graphs with graph visualization
Layered on top of a graph database, graph visualization is a powerful tool for knowledge management and data analysis. Graph visualization provides a visual representation of knowledge graphs, allowing users to gain deep insights and a comprehensive understanding of complex data relationships. It helps both business users and data analysts to unlock hidden patterns, identify trends, and make more informed decisions.
There are a number of ways graph visualization does this for knowledge graphs:
Uncovering complex relationships
Graph visualization is able to reveal intricate relationships within a knowledge graph. By representing entities as nodes and relationships as edges, graph visualization allows users to visually explore connections that might be challenging to grasp in a traditional tabular or textual format. Visual representations enable users to identify clusters, hierarchies, and dependencies, leading to a more holistic understanding of the underlying data.
Navigating large-scale knowledge graphs
The diverse datasets that may feed into a knowledge graph can cause them to grow exponentially in size, in turn making it overwhelming to comprehend their intricate structures. Graph visualization tools provide an intuitive way to navigate and explore large-scale knowledge graphs. Users can expand nodes and apply filters to focus on specific entities or relationships. It’s also possible to visualize changes to the knowledge graph over time. This interactive exploration capability enables users to analyze the graph from different perspectives and uncover meaningful insights.
Identifying patterns and anomalies
Patterns and anomalies that might remain hidden in traditional data representations become more apparent using graph visualization. By applying graph algorithms, such as centrality algorithms or similarity algorithms and visualizing the graph using force directed or hierarchical layouts, similar entities tend to cluster together, and outliers are visually distinct. These visual cues can help identify patterns, trends, and outliers, facilitating data-driven decision-making and anomaly detection.
Collaboration and knowledge sharing
Visualizations are excellent tools for communicating complex information effectively. Sharing graph visualizations with stakeholders or team members promotes collaboration and facilitates knowledge sharing. By presenting knowledge graph visualizations, both technical and non-technical audiences can grasp complex concepts quickly and engage in meaningful discussions. Additionally, graph visualization tools such as Linkurious Enterprise enable you to customize your visualization to build your own visual language, facilitating collaborative exploration and collective knowledge building.
Conclusion
Leveraging graph technology enables all kinds of organizations to unlock their data’s potential in a practical and comprehensive way. Graph databases provide efficient storage of interconnected information and a lightning-fast analysis experience, while graph visualization tools make it easy to intuitively analyze complex datasets and conceptualize relationships. When it comes to tackling the challenge of big data, detecting patterns, exploring connections, making predictions, and building smarter applications, graph visualization is an invaluable tool for discovery.
Start visualizing your knowledge graphs with Linkurious Enterprise and get ready to take your data strategy one step further.
*Special thanks to Memgraph. This post is partially based on their article “4 reasons why graph tech is great for knowledge graphs”.
A spotlight on graph technology directly in your inbox.