Uncovering the exceptional: Anomaly detection in complex connected data
It’s no secret that data often holds the keys to business successes and failures. Businesses live and die by their ability to gather insights and manage risks by understanding the outliers hidden within massive datasets. Anomalies - events or patterns that deviate from the norm - can be the key to unlocking opportunities or mitigating threats. This makes anomaly detection - also called outlier detection - crucial for organizations across industries.
From financial fraud to cyberattacks to changing consumer behavior, anomalies can indicate a wide range of issues or opportunities. In this article, we will explore what exactly anomaly detection is and why it provides value for businesses today. We will also look at some common anomaly detection use cases across sectors.
Finally, in a context where businesses are working with large networks of complex, interconnected data, graph technology emerges as a powerful tool for anomaly detection, allowing you to cut through the noise to find the signals that matter. In particular, we’ll look at how powerful graph analytics can combine weak signals and surface complex patterns that would remain hidden with traditional methods, delivering the insights you need for business safety and growth.
What is anomaly detection?
Harvard psychologists ran an experiment years ago (1) where they asked participants to watch a video and count the number of times players wearing white passed a basketball. In the middle of the video, a gorilla walks through the scene, pounds its chest, then exits the frame. More than half the participants missed the gorilla entirely.
In this scenario, the gorilla was the anomaly - something that deviated from what was expected. When we’re talking about anomalies in data, it’s just that: outliers that are rare events or occurrences falling outside what is standard, expected, or business as usual. And just like the participants in the gorilla experiment, many of us fail to spot anomalies on our own since our attention is focused elsewhere, which is why businesses rely on anomaly detection systems.
Anomaly detection in the business world
Take the example of a bank monitoring credit card transactions to watch for potential fraud. Normally, customer purchases fit established patterns in terms of transaction size, merchant, location, etc. But a sudden series of abnormal charges would be flagged as an anomaly - an odd behavior that deviates from the norm and signals potential credit card fraud.
Or imagine a cyber security team keeping tabs on traffic levels on a corporate network. Bandwidth usage tends to follow typical rhythms and volumes based on work flows. A sudden, late-night traffic spike could signal a potential denial-of-service attack.
In both cases, the anomalies point to rare and exceptional events that demand attention - possible fraud and a potential cyberattack. Anomaly detection is the process of surfacing these outliers, digging into the data to uncover events and patterns that stray from what is standard or expected. Identifying anomalies helps pinpoint problems, risks, and opportunities hidden within massive datasets.
Why anomaly detection is important
Anomaly detection provides critical value to businesses today by enabling data-driven insights, risk management, and helping identify the root causes behind events. Here's a look at why surfacing anomalies is so essential:
Extracting business insights and operational intelligence
Detecting patterns that deviate from the norm is key for gathering essential business insights. Anomalies indicate that something unexpected is happening, whether it's a worrisome drop in website traffic or an unexplained spike in manufacturing defects. Understanding these outliers helps managers spot problems in core operations, seize new opportunities, and make data-informed decisions.
Managing risk
Anomalies often relate to rare incidents that represent risk: financial fraud in banking, network intrusions in cyber security, or equipment failures in manufacturing plants, to give some examples. By flagging these anomalies, businesses can take steps to minimize risk exposure and take action before significant damage is done.
Getting to the root cause
With sometimes millions of data points to monitor, understanding why something is occurring can be a challenge. Whether you’re seeing an impact on revenue, web traffic, or something else, identifying anomalies can help you get to the root cause of important changes in your business. They point analysts in the right direction of where to investigate further.
Anomaly detection use cases
Anomaly detection is important for businesses across many industries. Here’s a snapshot of how different industries can leverage anomaly detection for compliance, risk management, and better business outcomes to give an idea of what it looks like in practice.
Cyber security
Within cyber security, anomaly detection is critical for recognizing unusual activity on networks that may be a red flag for hackers or malware. Solutions can monitor network traffic for bandwidth spikes, abnormal login attempts, and other anomalous behaviors that deviate from normal patterns. Flagging these outliers enables rapid response to potential attacks.
IT
For IT infrastructure, anomaly detection helps identify performance issues and hardware faults by tracking metrics like CPU usage, memory, and disk space. Unexpected surges or drops in these measurements can signify emerging server failures or software bugs. Early anomaly alerts allow preventative action before problems escalate.
Anti-money laundering
For financial institutions, a key application is detecting anomalous transactions that may be indicative of money laundering schemes or other financial crime. Anomaly detection models profile expected customer transaction patterns and flag outliers that fall outside these norms as potentially suspicious for further investigation.
Fraud detection
In a similar use case, anomaly detection is essential for uncovering credit card or benefits fraud. Suspicious transactions that deviate from regular cardholder spending in terms of amount, location, or vendor can be flagged for fraud investigation. In the case of benefits fraud, multiple benefits accounts linked to a single bank account is an outlier that may signal fraud.
Supply chain management
In supply chain management, anomalies can flag all kinds of important information: potential product theft, inaccuracies, inefficiencies, etc. By analyzing inventory data, abnormal shrinkage, waste, or delivery times that deviate from historical baselines become visible. This empowers root cause investigation to optimize processes and minimize potential losses.
Anomaly detection and the big data challenge
Organizations today often have huge amounts of data at their fingertips. While an organization’s data often holds the key to identifying important anomalies, traditional methods may involve the tedious examination of vast amounts of data stuck within silos. Or, they may overlook critical connections between various data patterns, leading to information gaps and a lack of context.
Businesses across industries often contend with several challenges when working with large, complex datasets.
- Needle in the haystack: Modern organizations often accumulate huge masses of data across systems and channels. Manually sifting through all this data to uncover anomalies is like finding a needle in a haystack - near impossible.
- Scaling limitations: In the past, small datasets allowed anomalies to be detected manually by analysts reviewing data. But manual review does not scale well for today's high data volumes and velocities.
- False positives: Simple rules-based systems often incorrectly flag normal events as anomalies. Sorting through these false positives diverts analyst resources.
- False negatives: Anomalies can go beyond the clear outliers. Sometimes isolated events won’t appear to deviate from the norm, but in analyzing the broader context, anomalies may arise in a seemingly normal flow of data. And many tools struggle to analyze the full context.
- Blind spots persist: Without the right tools and techniques, blind spots persist where genuine anomalies go undetected, leaving organizations vulnerable. This risk exposure continues to grow as data complexity and scale increases.
To keep risk in check and minimize blind spots, all types of organizations need accurate anomaly detection on massive, interconnected datasets. Legacy tools fall short on leveraging big data for reliable anomaly detection and root cause analysis. More modern approaches are needed.
Using graph visualization and graph analytics for anomaly detection
Graph technology can be a game changer for anomaly detection. Let’s look at why many organizations find it to be their preferred solution.
Graph technology 101
First, let’s quickly go over the basics of graph technology.
In a graph data structure, the relationships within the data are as important as the individual data points. Graph technology leverages graph databases, which store data in a network structure with relationships modeled as connections. This structure consists of nodes (data points like individuals, transactions, devices, etc.) and edges (the links between nodes, representing relationships).
The connected structure of graphs makes them well suited for revealing anomalies. This network analysis lens is ideal for finding outliers indicative of things like fraud, network intrusions, equipment defects, and more. Graphs are able to model the complex data relationships and interdependencies critical for accurate anomaly detection. They also provide the analytical power to pinpoint anomalies that other tools often miss.
Using contextual information to supercharge anomaly detection
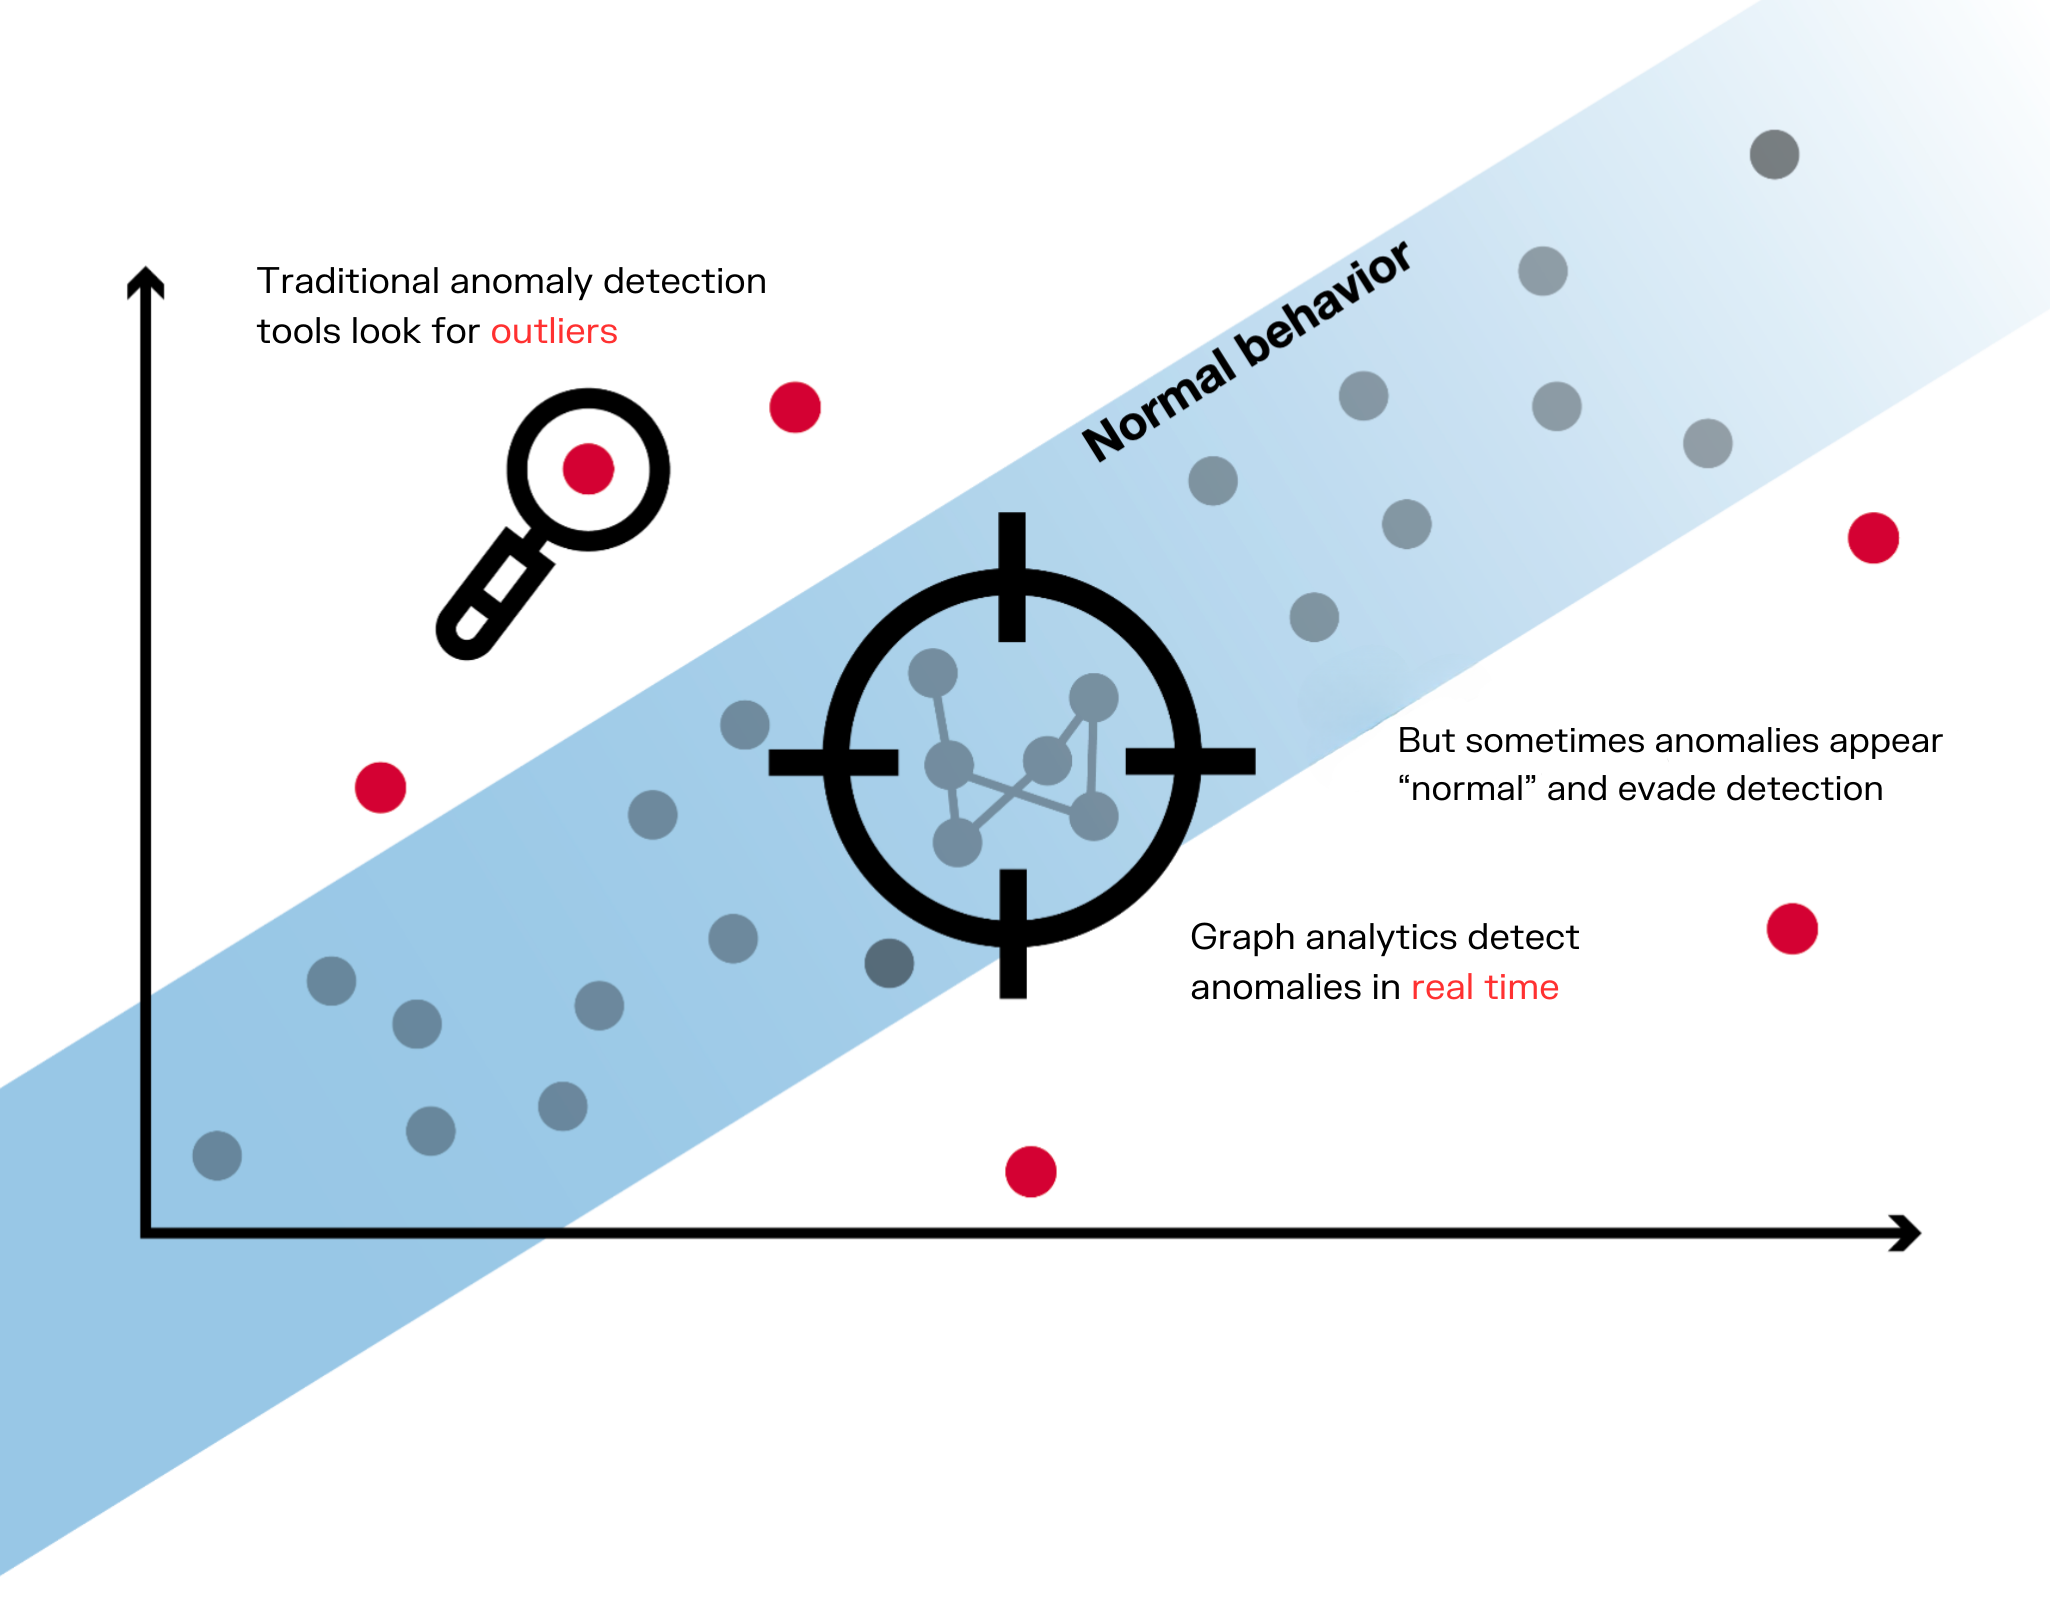
Anomalies and outliers within complex networks of data aren’t always readily apparent. Simple rules-based systems will surface many anomalies - but not all of them. In many cases, without an understanding of the full context around your data, anomalies will go undetected, leaving you with blind spots and false negatives.
This is where a graph approach can help. By de-siloing data and enabling an analysis of the connections within, graph offers contextual anomaly detection. Graph analytics can combine low signals and patterns to deliver a full holistic view and a more detailed understanding of anomalies to even better manage their potential impact and prevent important insights from slipping through the cracks.
Think about the Harvard gorilla experiment again. Most anomaly detection models are tuned to find a certain type of event, just like the experiment participants were instructed to count the passes between white-shirted players. They miss certain abnormalities that are outside of their detection scope. With a graph approach that analyzes the full context, on the other hand, a strange pattern - like a gorilla strolling through a basketball drill - will send up a red flag.
Graph visualization for easy exploration
Graph visualization adds an extra dimension to understanding the anomalies within your data. Visual information is much easier to understand than textual information. A graph visualization allows you to explore the full context at a glance. It enables you to see all the connections around the anomalies in your data for both a faster and deeper understanding of the full picture.
Multi-model alerts for anomaly detection
Advanced graph-based solutions come equipped with features to quickly pinpoint the anomalies that are important to your business, even within very complex data.
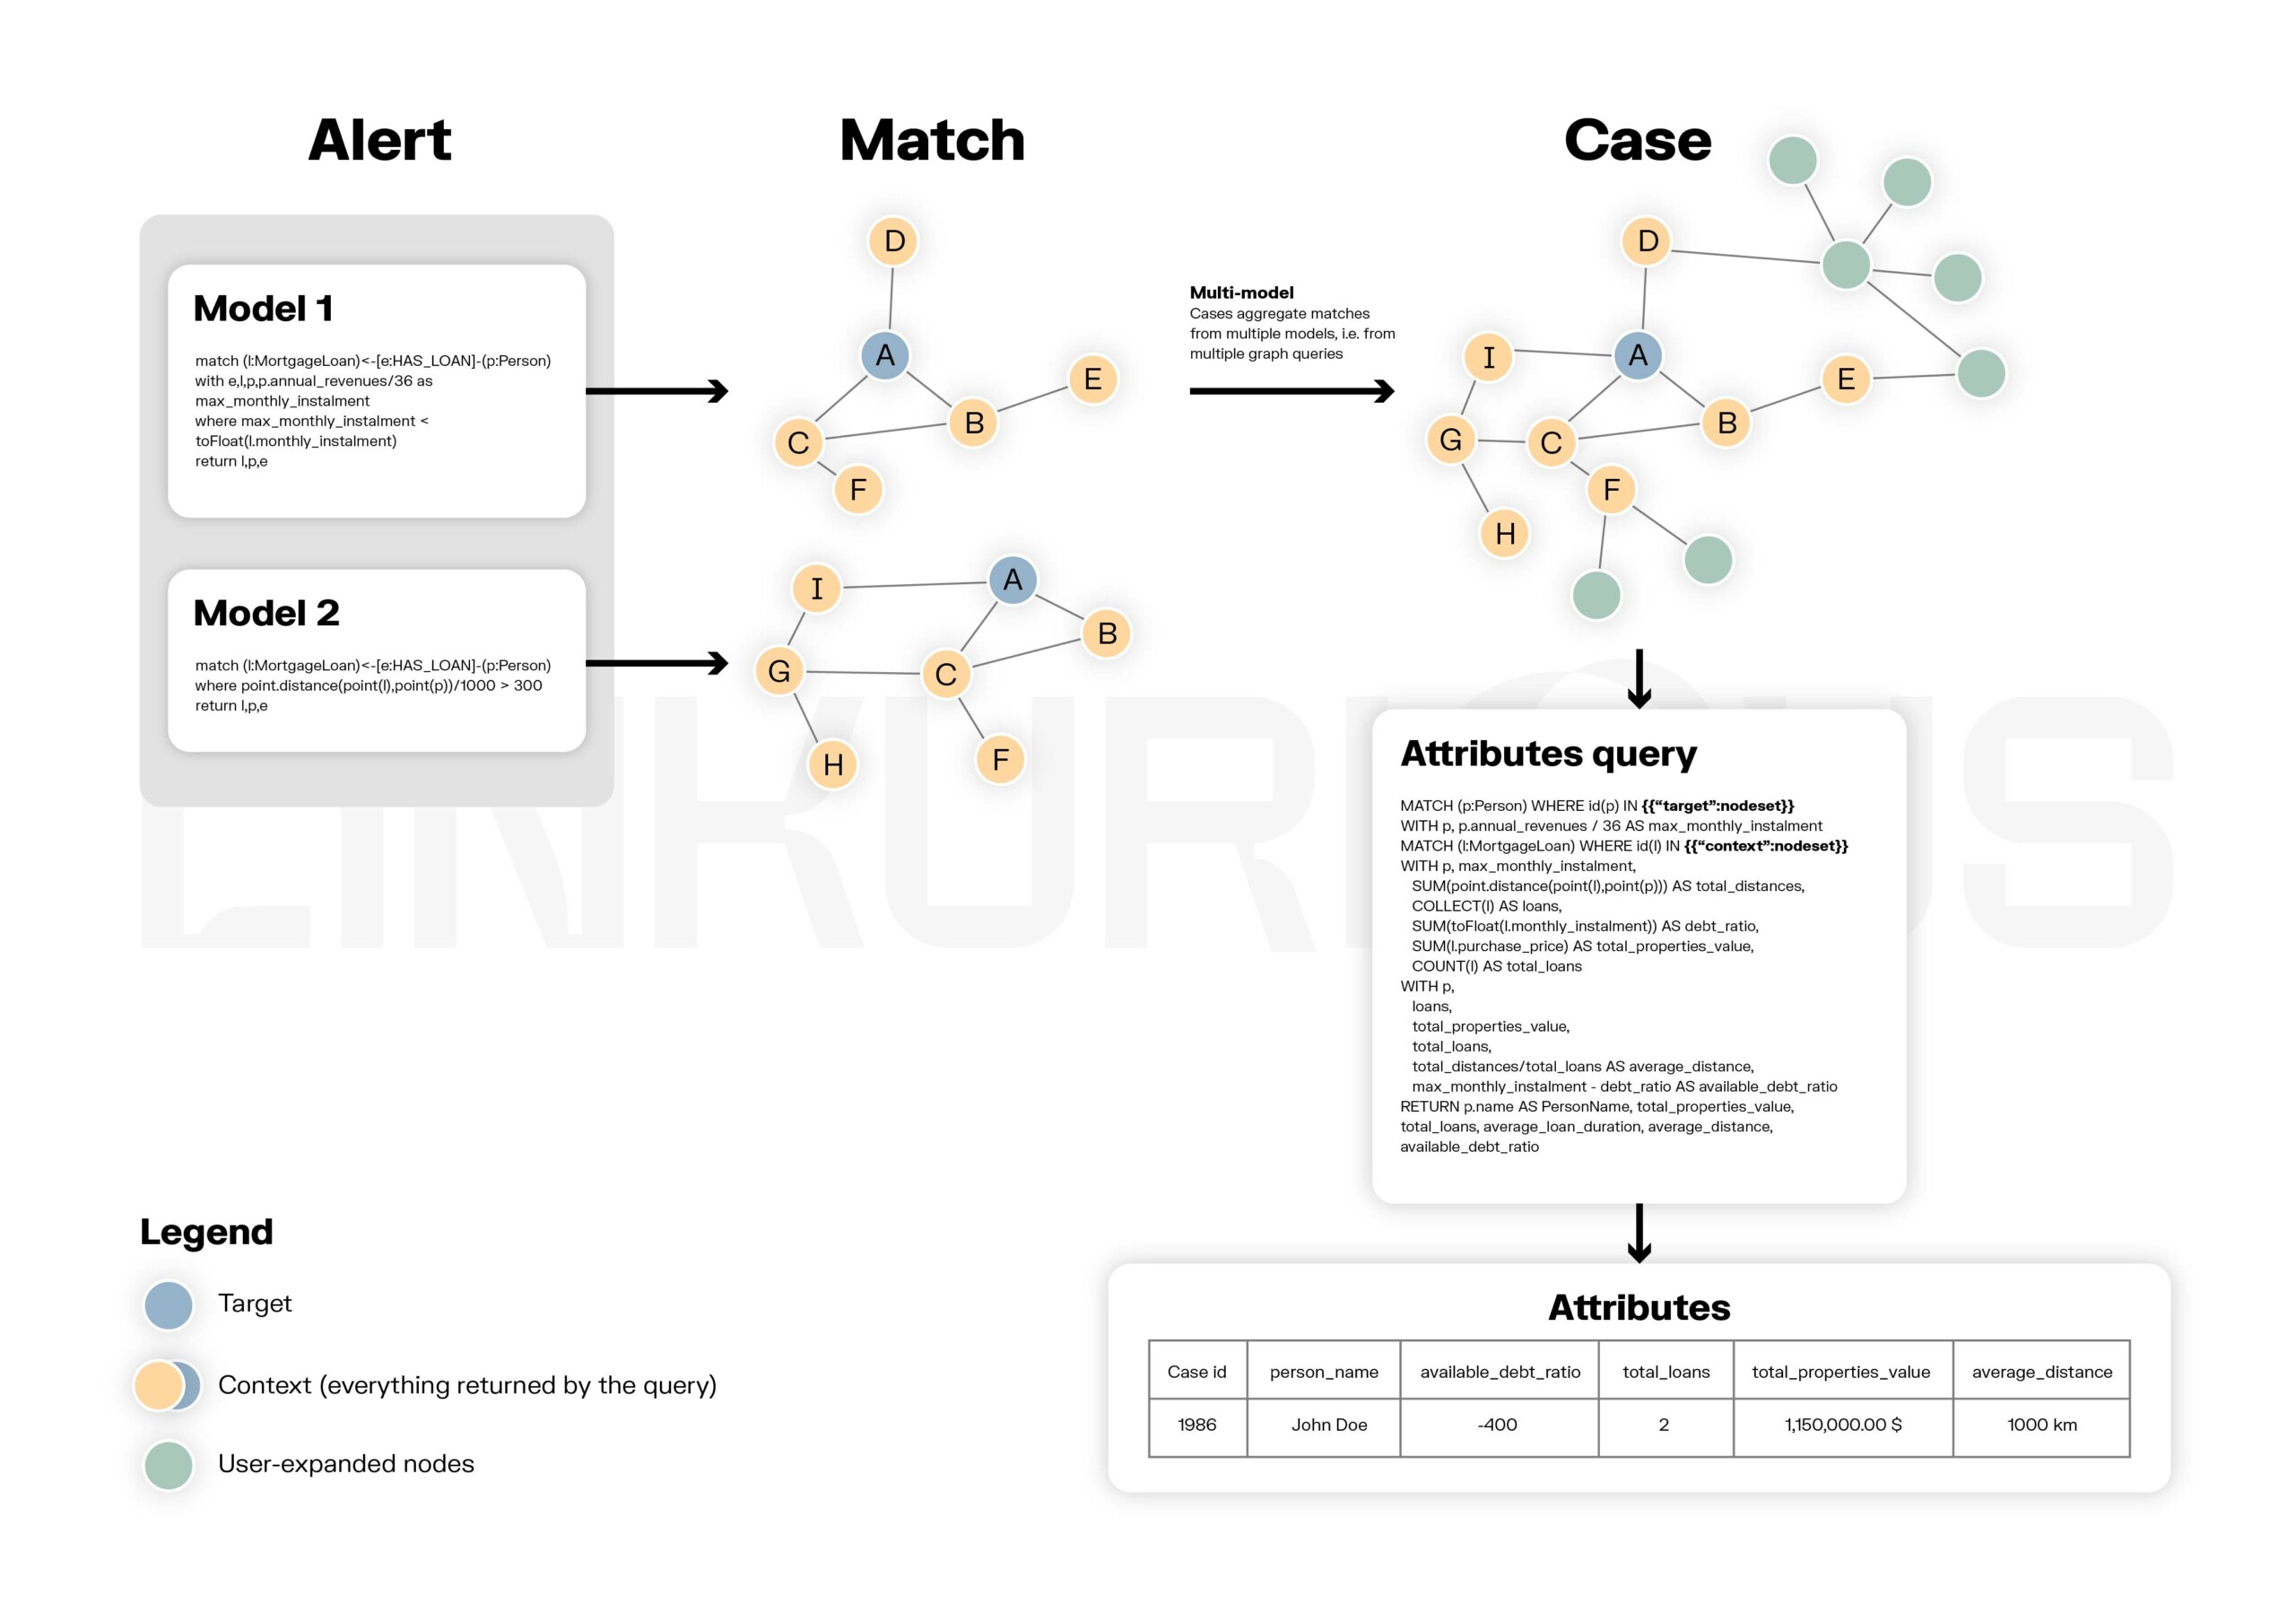
Multi-model graph alerts in Linkurious Enterprise are a key milestone in innovative graph-based anomaly detection. Multi-model alerts transform the process of anomaly detection by aggregating multiple detection rules powered by graph analytics into a single alert. In doing so, they uncover more complex hidden patterns which are sometimes a combination of weak signals, delivering a maximum amount of context to analysts and investigators, reducing their backlog.
In multi-model alerts, a model refers to a subset of criteria representing one detection pattern. “Multi-model” refers to a configuration using multiple models in a single alert to ensure deduplication and simple, maintainable models. By grouping models into a single consolidated case, analysts get the full context they need to make a decision.
Multi-model alerts in Linkurious Enterprise are beneficial for a wide range of use cases. Take the example of social benefits fraud, where bad actors often work in networks and scams evolve quickly. Multi-model alerts perform well in detecting the full extent of suspicious activity, even when it’s complex. And you can modify the models making up an alert as new schemes are identified.
Learn more about how you can benefit from multi-model alerts in Linkurious Enterprise.
Conclusion
Anomaly detection is essential for managing risk and identifying insights within vast quantities of data. But finding those crucial outliers and critical events can prove challenging, especially within complex, interconnected datasets.
With their relationship-based network structure ideal for modeling connections in data, graph solutions empower businesses to uncover anomalies other tools miss. By leveraging the analytical power of graphs and advanced features like multi-model alerts, organizations across industries can achieve more accurate, scalable anomaly detection.
(1) https://www.npr.org/2010/05/19/126977945/bet-you-didnt-notice-the-invisible-gorilla
A spotlight on graph technology directly in your inbox.