Enhancing insurance fraud investigation with graph analytics
Insurance fraud investigation is high-stakes work. Insurance fraud costs the average family in the US between $400 and $700 per year in increased premiums, according to the FBI (1). And the Coalition Against Insurance Fraud estimates that insurance fraud costs US consumers $80 billion each year (2).
Catching the experienced criminals behind insurance fraud schemes presents several challenges, though. What makes insurance fraud investigations such exacting work? And what solutions can technology - in particular graph technology - offer to improve the process?
Detecting and investigating insurance fraud
Within an insurance company, special investigations units are tasked with detecting and investigating suspected insurance fraud. To do this, fraud analysts constantly monitor and screen activity to find indications that insurance claims fraud might be occurring.
Analysts within special investigations units are under a great deal of time pressure as they investigate possible insurance fraud. Not every suspicious claim will turn out to be a confirmed fraud case, and the insurance company must reimburse customers who file legitimate claims as quickly as possible. At the same time, fraud investigators are under pressure to ensure that truly fraudulent claims don’t slip through the cracks.
Today, insurance fraud investigations units are relying increasingly on new technology and new investigation methods to speed up investigations without sacrificing accuracy to provide positive customer experiences while effectively fighting fraudsters.
Insurance fraud investigation challenges
Insurance fraud investigation presents several challenges, and in some ways is getting even more complex to manage.
First, many fraudsters operate like professionals, working in organized groups. They are experts at exploiting new technology and taking advantage of loopholes and blindspots to evade detection. Professionalized fraudsters are also constantly seeking out new ways to carry out fraud schemes. Their scams can be complex, with several layers and many accomplices. These factors can make getting to the bottom of an investigation difficult.
Insurance fraud investigations have also become dependent on data. A lot of information goes into investigating suspicious claims, including:
- Internal data
- National or international databases
- Social media data
- Any other information potentially related to a claim: billing data, medical history data, and more
Investigators must find clues and connections within these various sources. When this data is siloed, this work is time-consuming and prone to error.
Finally, anti-fraud professionals rely on a number of automated tools. These automatic detection systems are very useful as they save time and manual effort for investigators. On the other hand, traditional rules-based systems generate high numbers of false positives.
Bringing speed and accuracy to insurance fraud investigation with graph technology
A lot of insurance fraud investigation work requires insurers to identify suspicious connections to identify if a given incident is actually part of a larger crime or if one individual is a participant in a more extensive crime ring. Understanding connections is particularly important when dealing with complex insurance fraud schemes.
Graph analytics can be a powerful solution to this challenge. Graph analyzes both individual data points - called nodes - and the connections between them - referred to as edges or relationships. Graph technology thrives on high levels of complexity and uses advanced algorithms to connect the dots between multiple data points and sources to quickly find suspicious connections. This speeds up case triage and helps reduce false positives. These characteristics make it a powerful tool for insurance fraud investigations.
Here are some examples of how graph analytics can help with insurance fraud detection and investigation.
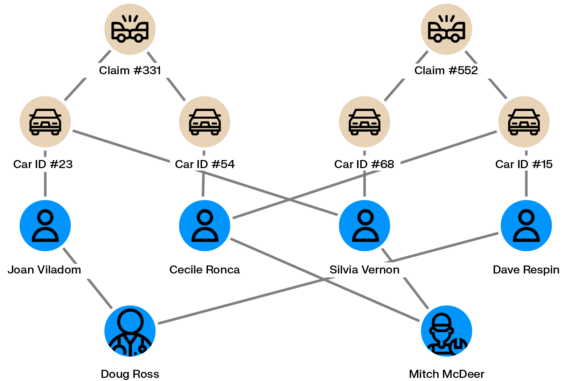
Fraudulent car accident claims
Some fraudsters generate fake car accident claims to make money. An individual can take out a car insurance policy, then claim a refund on a non existing car accident with the help of a complicit car repair shop.
Scaling fake car accidents requires multiple policyholders, multiple vehicles and multiple passengers. Graph analytics can help identify if within an insurance company’s client database multiple people are interconnected across vehicles, individuals, repair shops or claims. The larger the network, the more likely that fraud is going on.
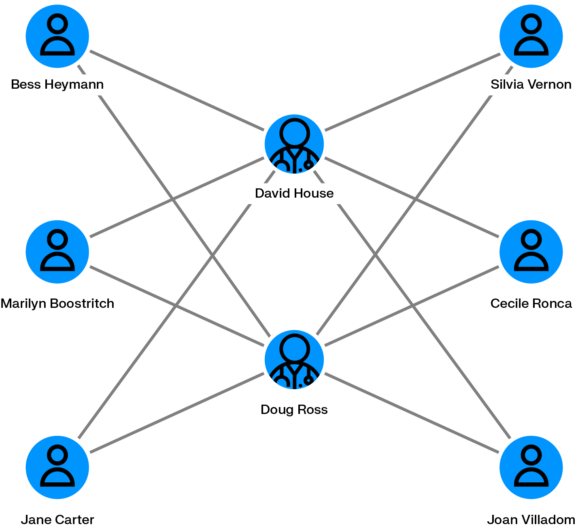
Health insurance fraud
There are many ways unscrupulous medical providers can defraud a health insurer. They may bill for services they have not actually provided, bill multiple times for the same service, perform unnecessary services that they then bill to the insurance company, etc. Covid-19 and an increase in telemedicine have only increased health insurance fraud opportunities. Health insurance companies then end up paying those fraudulent bills. This type of fraud can be particularly hard to stop when the services were performed on older patients.
Graph analytics can help spot anomalies pointing to this type of insurance fraud. With graph, you can quickly see if patients are seeing multiple doctors for the same procedures, medical professionals sharing many common patients, or doctors billing the same services multiple times to the same patient.
Homeowners insurance fraud
When a natural disaster strikes, corrupt contractors may take advantage of the situation for illicit gain. After a flood or hurricane, for example, a contractor inspecting the home may perform unnecessary repairs and bill those to the owner’s homeowners insurance.
Graph analytics can spot contractors frequently billing for the same services, or billing the same services multiple times. Graph analytics like Linkurious Enterprise can also layer in geographic information to identify precisely where a natural disaster occurred - and see if a home claiming damage is located within that zone.
Zurich Insurance: using graph to investigate insurance fraud
Zurich Insurance is Switzerland’s largest insurer, also operating in over 215 countries and territories. Within the Swiss branch of Zurich Insurance, the account fraud team assesses customer claims and investigates potential cases of fraud. They use Linkurious Enterprise for the job, alongside other tech solutions including Neo4j, for fraud detection and investigation.
In a recent webinar, we explored how Zurich Insurance approaches fraud detection and investigation practices. Watch the replay to see a demonstration of Zurich Insurance's workflow from alerts, to alerts triage, to investigation:
(1) https://www.fbi.gov/stats-services/publications/insurance-fraud
(2) https://insurancefraud.org/fraud-stats/
A spotlight on graph technology directly in your inbox.