Mapping the Syrian narcotics ecosystem with graph visualization
Over the last several years, the narcotics trade in Arab Asia, and particularly in Syria, has shifted significantly. Researchers and policymakers have observed a growing trade in captagon, an inexpensive, easy-to-produce drug that’s especially in demand in the Gulf region.
Researchers at the Observatory of Political and Economic Networks, working on a grant from the Foreign, Commonwealth & Development Office (FCDO) in the UK, set out to understand the networks surrounding the narcotics trade in and around Syria and Lebanon. They wanted to better understand which groups and individuals are involved in the regional narcotics network, and to understand the role of the al-Assad regime. Gaining a full understanding of the complex connections within the narcotics network came with certain technical requirements: they needed to gain visibility over the entire narcotics network. They also needed to visualize geospatial and temporal information. And, support for Arabic text was an essential consideration.
Gaining flexibility with Ogma graph visualization library by Linkurious
The analysts and researchers working on the report tested dozens of graph visualization tools to find the right solution. Ogma, the JavaScript graph visualization library from Linkurious turned out to be the tool that best met their needs for several reasons.
Most importantly, Ogma gave the research team a great deal of flexibility in terms of how they were able to display and interact with their graph visualizations. They were able to closely control many different elements in their visualizations: property information and labels, customized filters in the sidebar, legends, and overall look and feel. “Ogma gave us a high level of customization,” says Wael Alalwani, network analyst on the research team and co-founder of the non-profit organization Obsalytics.
Furthermore, Arabic text is well supported by Ogma, which was an essential consideration given the region of focus. The team was also able to add a feature to instantly give context around entities, bringing up an information panel on the graph visualization when a user clicks on a node.
Uncovering hidden relationships in the narcotics network
Once they developed their application using Ogma, the research team was able to visually analyze their data. All drug cartels operate with extensive networks, but they go to great lengths to keep the connections within their networks hidden. Being able to visually map out those networks is a powerful tool to understand the flows of narcotics and cash, and the people and organizations involved.
Using graph, the researchers were able to map out relevant actors in the network, along with the relationships involved in the supply of narcotics from Syria - and to a lesser extent from Lebanon. Those entities include private companies, public sector organizations, customs agents, organized crime groups, money launderers, paramilitary groups and militias, and more.
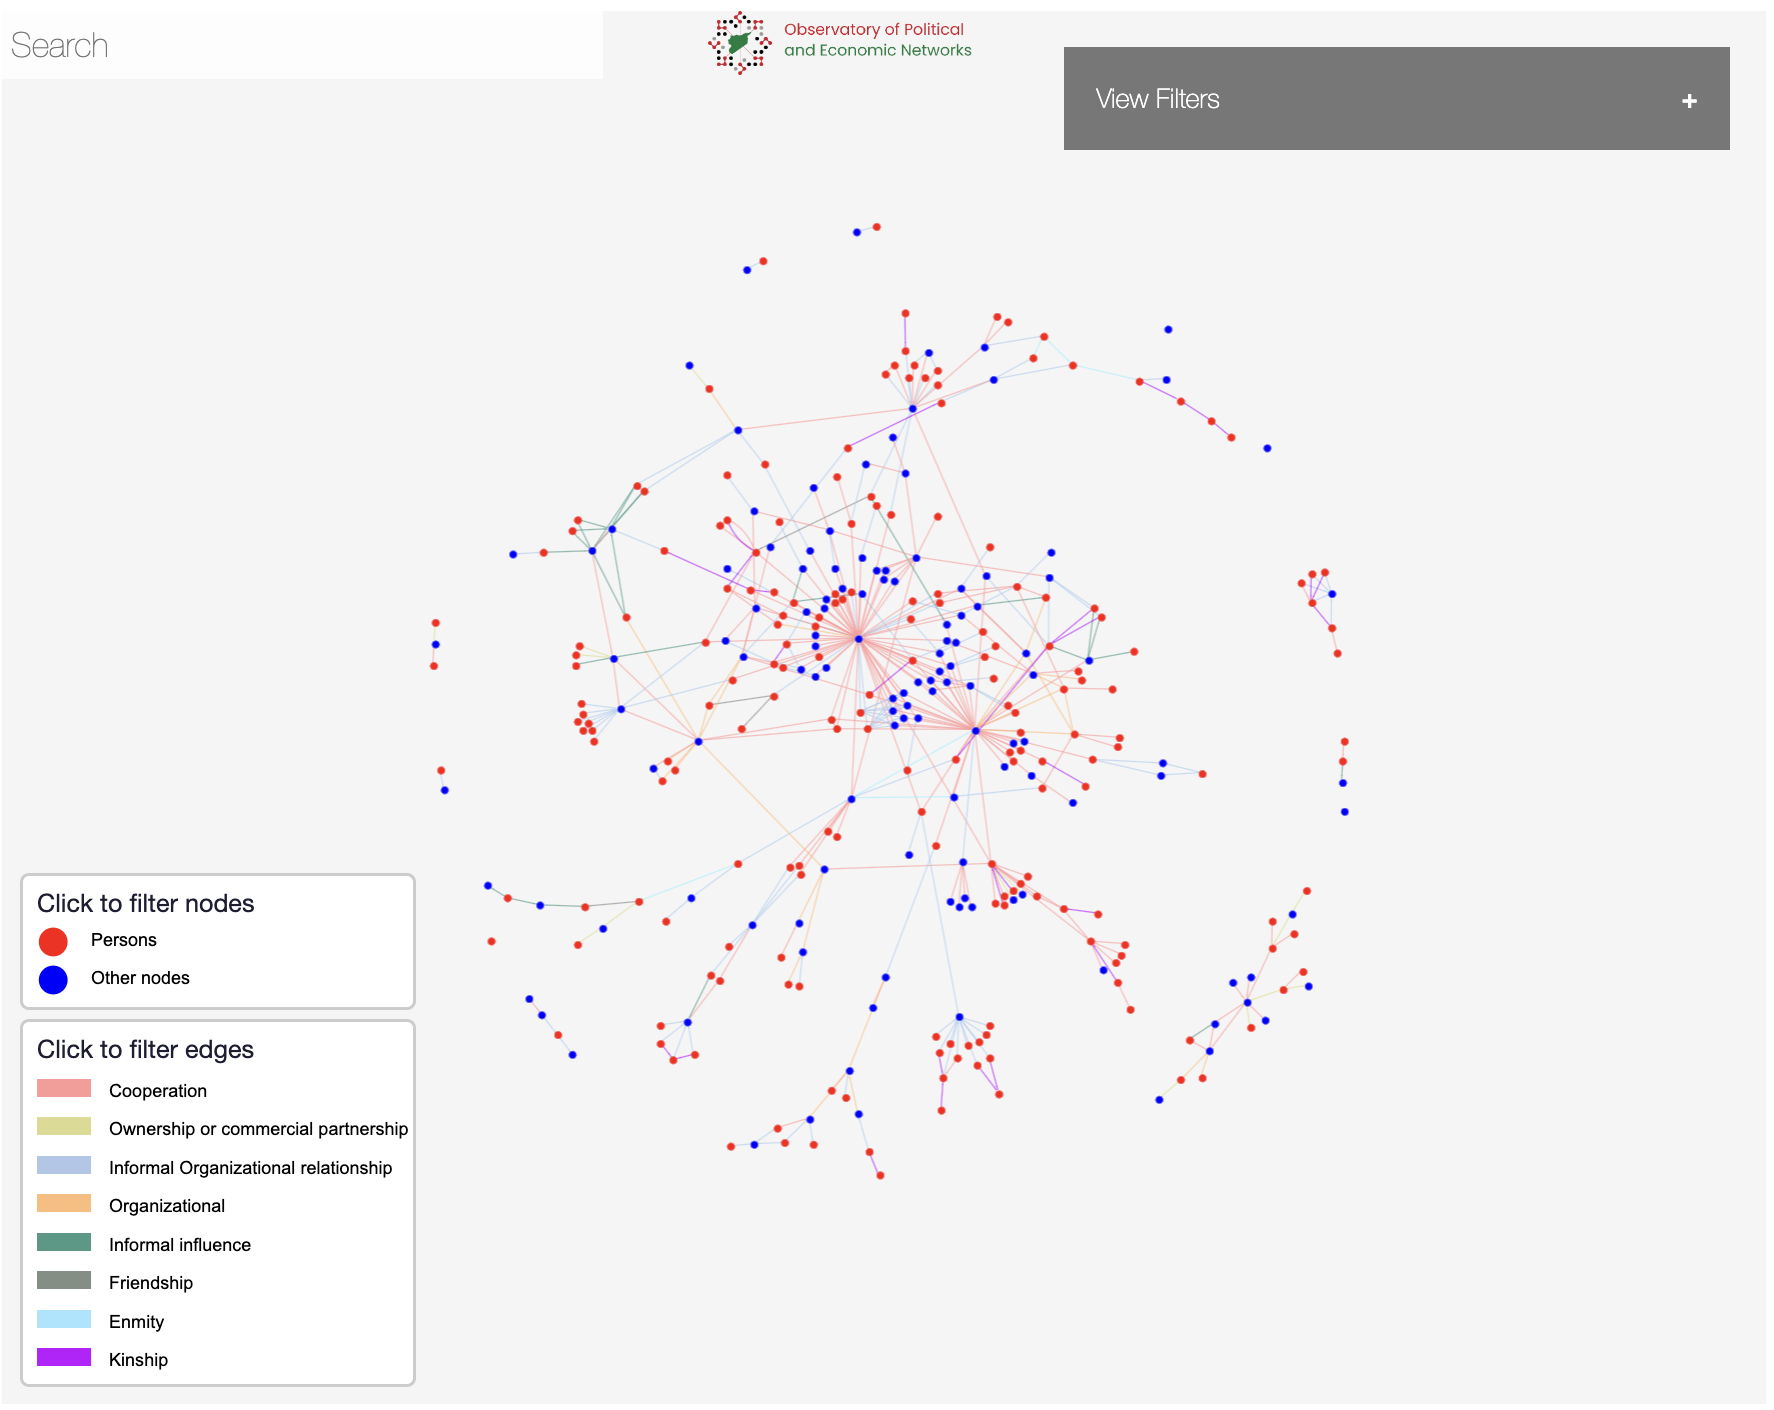
Graph visualization enabled researchers to see who is central in this complex narcotics network. The network database revealed that entities aligned with the Assad regime, including the Fourth Armored Division, the Military Intelligence Directorate, Lebanese Hezbollah, and the National Defense Forces, are responsible for a great deal of the narcotics supply originating in Syria. The researchers also confirmed the involvement of several members of Assad’s family and discovered their extended networks.
Without graph, “people could read about our findings, but they wouldn’t be able to envision it. Graph visualization shows exactly who is at the center of the network,” says Wael Alalwani. Graph also made it easy to see the indirect connections within the network. It’s relatively easy to see when two entities are directly involved with each other. It can be much more difficult to see when two entities are two or three hops away from each other, but in a graph visualization, this information is immediately apparent. This made it possible for the researchers to understand even the more informal relationships within the network.
Getting time-sensitive and geographic insights
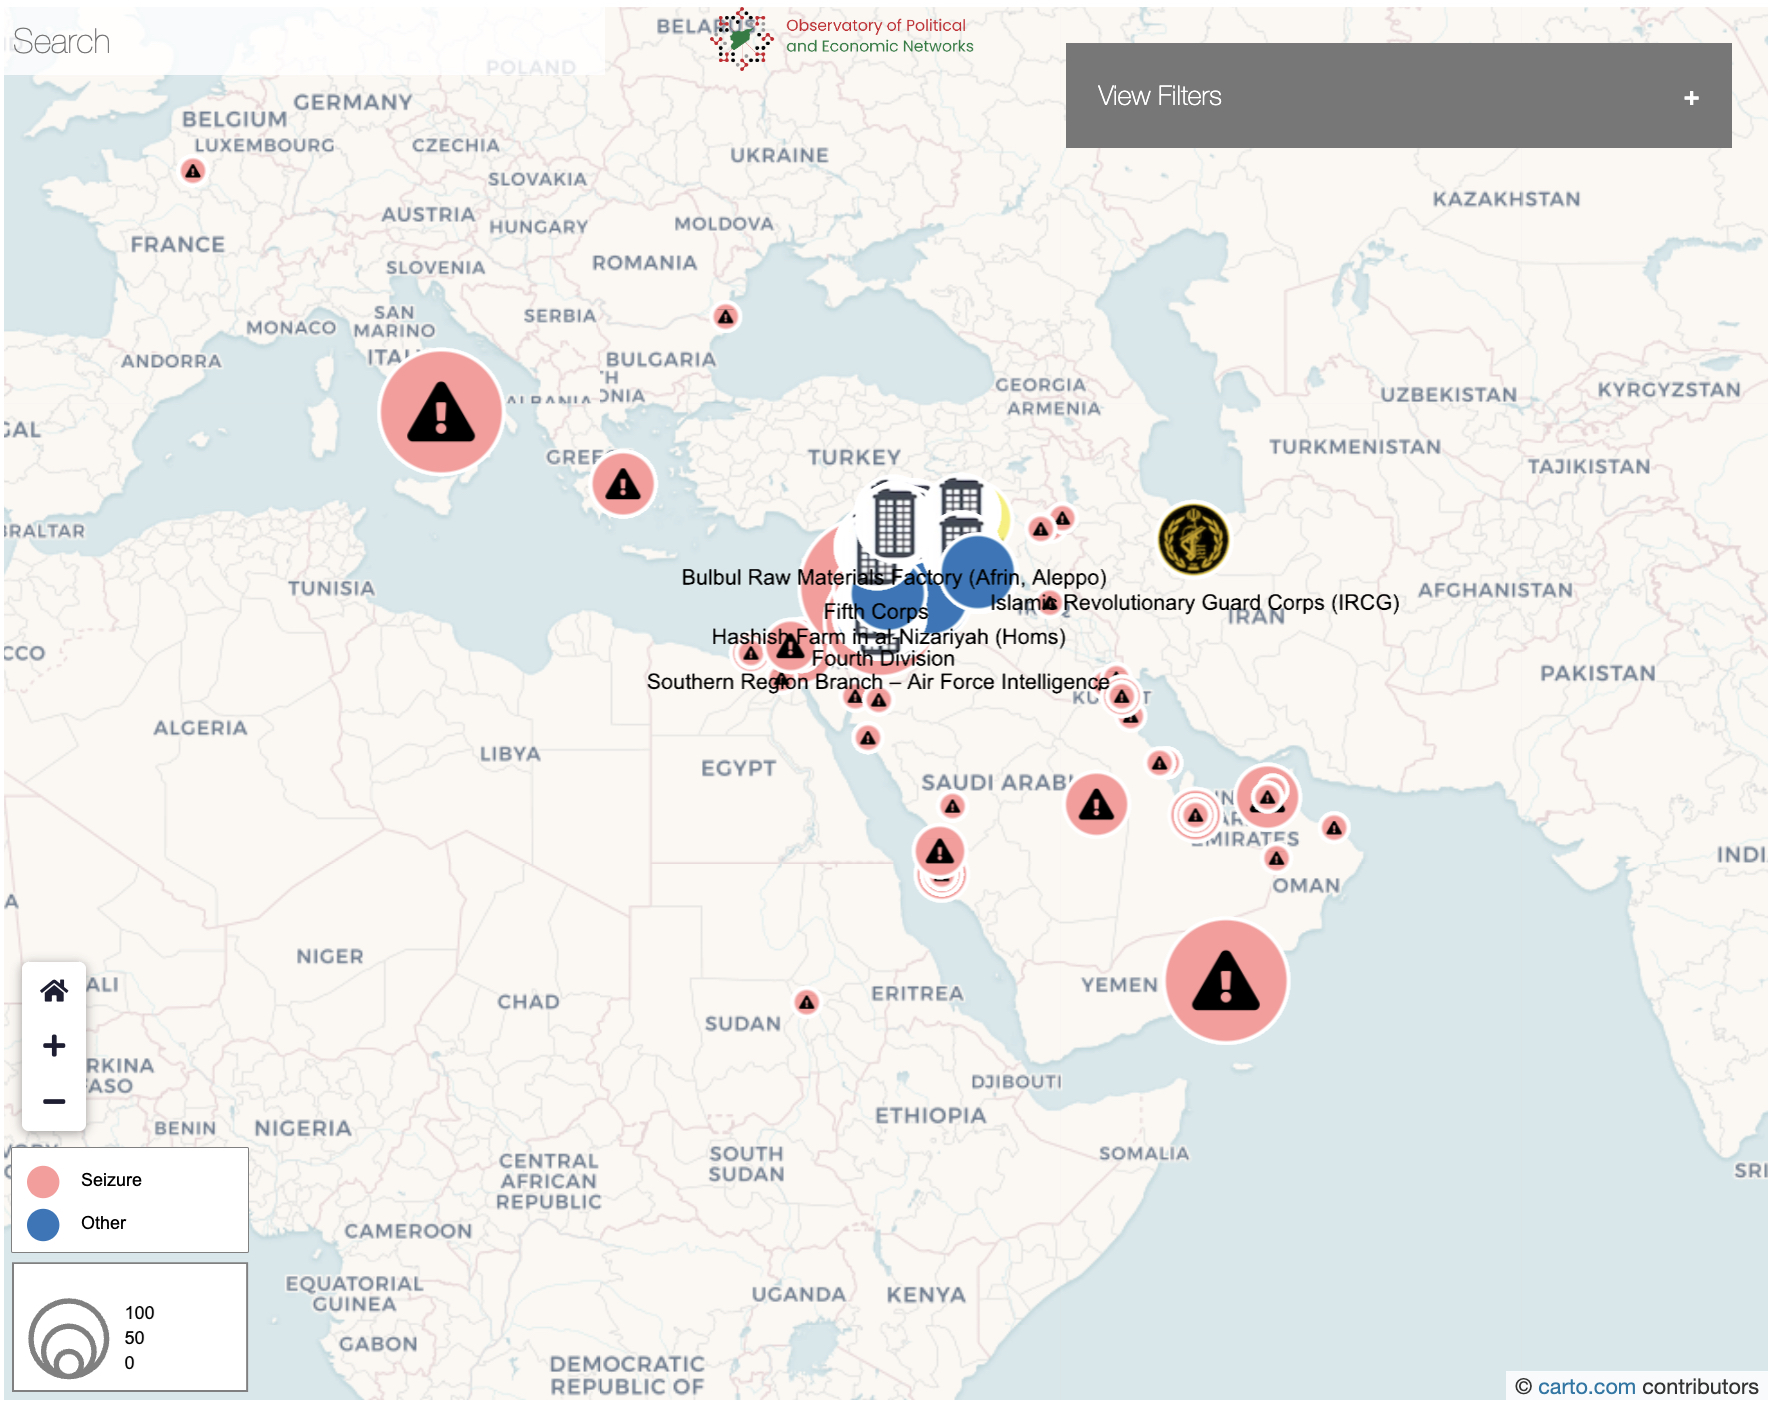
Different filtering features in Ogma allowed the researchers to visualize their data in the way that was most valuable to them. Mapping features enabled the team to visualize the narcotics network on a map, making for a quick and easy understanding of its geographic reach.
They also made use of time filters. This enabled the team to see how narcotics networks evolved over time or in relation to specific events. Tracing events and evolutions over time has also been useful for benchmarking.
Informing policy and future research
The team behind the report has presented their findings to policymakers and government agencies in the UK and the US. The goal of the findings is to help those governments better understand how to mitigate these illicit narcotics networks. Visualizations are helping observers understand the impact of targeting one part of the network versus another.
The research team plans to continue digging into the data and building on their existing research to gain a deeper understanding of the captagon trade within Syria, the impact of sanctions on the trade, and more. They’ll continue to use graph visualization: “If we do another project, Ogma is definitely a solution we would use,” says Wael Alalwani.
Following the money with graph technology
The reception of the kinds of visualizations the researchers have provided has been very positive. From think tanks to researchers to private sector companies, clear visualizations of key networks have facilitated communication of their findings.
“Graph technology is very relevant to the use cases we’re working on,” says Wael Alalwani. “For financial crimes, when you need to follow the money, graph technology is really the way to go. The focus on relationships, on indirect relationships - it’s really aligned to the kind of research we’re doing.”
A spotlight on graph technology directly in your inbox.