Is Linkurious Enterprise an alternative to SAS Visual Investigator?
SAS® Visual Investigator is a tool that is familiar to many intelligence analysts and investigators, since it’s an investigation solution from a longstanding software provider. At Linkurious, prospective clients sometimes ask whether Linkurious Enterprise is an alternative to SAS Visual Investigator, as they search for the right tools to manage increasing complexity in their investigations.
Here’s a guide to how these investigative solutions compare, which we’ve broken down into 4 key differences.
What Linkurious Enterprise and SAS Visual Investigator both offer
First, let’s look at some of the similarities between these two products since there is a lot of overlap in features and functionalities. Linkurious Enterprise and SAS Visual Investigator both offer core features to facilitate detection and investigation of suspicious activities and help investigative teams gain in speed and efficiency.
In terms of investigation capabilities, both SAS Visual Investigator and Linkurious Enterprise include:
- Alert creation and management
- Advanced search within data
- Network analytics and visualization including
- Filter and visualize data
- Timeline and geospatial analysis
- Styling capabilities
Both software solutions also offer time-saving case management features:
- Create cases from alerts
- Prioritize and assign cases
- Triage cases to filter out the ones requiring further investigation
- Streamlined workflows
So what sets Linkurious Enterprise apart from SAS’s solution?
Where SAS Visual Investigator and Linkurious Enterprise differ
High performance and scalability
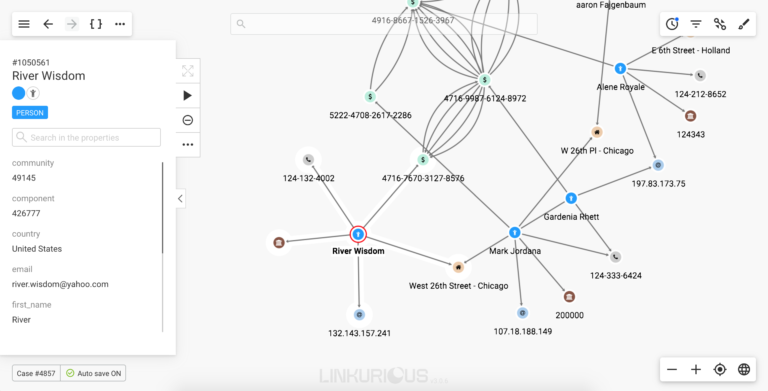
SAS Visual Investigator analytics capabilities are based on traditional relational database technology. While relational databases are good for routine data analysis, they come with drawbacks: analyzing complex connected data comes with a high computational cost and can result in slow performance. Linkurious Enterprise, on the other hand, is natively built for use with graph databases which are increasingly adopted among leading organizations in addition to relational databases to overcome their limits. Gartner predicts that by 2025, graph technologies will be used in 80% of data and analytics innovations (1). These databases contain nodes (individual data points), relationships, and properties.
A graph data model makes it intuitive to represent relationships and it performs analysis very quickly. Analysts can then easily explore within complex connected data in unified databases to get deeper insights and more efficiently understand the context surrounding suspicious activities. This type of technology is also highly scalable to handle extremely large datasets without compromising on performances.
Being natively built on graph technology means that with Linkurious Enterprise, you can dynamically explore complex networks without suffering from slow performance. The technology behind Linkurious Enterprise also lends itself perfectly to detecting complex patterns and quickly identifying suspicious activities.
Ease of use
SAS Visual Investigator has many features available for its users, offering advanced possibilities for investigations. But, according to some of its users, the tool can be difficult for them to fully master.
Linkurious Enterprise also has many advanced features, including the ability to style data and change layouts, group relationships for more streamlined visualizations, use query templates to automatically identify important information, consolidate duplicate cases, and more. But Linkurious Enterprise also has an intuitive user interface to help investigators and analysts navigate easily. It’s designed with both technical and non-technical users in mind, so it’s easy to get up and running even for users without technical know-how.
Open architecture
SAS Visual Investigator requires clients to buy into the SAS ecosystem, tying them to one vendor for detection, case management, and data exploration capabilities but also cloud computing.
By design, Linkurious Enterprise has been built to leverage other tools, including open-source solutions such as ElasticSearch, Neo4j, or CosmosDB. It can also easily be integrated into existing applications via its web-based API. Using Linkurious Enterprise, you can tap into a large ecosystem of graph databases to ensure you benefit from multiple top technologies and virtually achieve the highest possible performance. It’s also easy with Linkurious Enterprise to integrate graph analytics and visualization into existing tools to strengthen your investigative capabilities and continue to capitalize on legacy systems, maximizing the value of your IT investments.
Cost efficiency
Linkurious Enterprise and SAS both offer advanced investigation capabilities with many comparable features, helping analysts run faster, more efficient investigations. Linkurious Enterprise pricing makes it more financially accessible, however. The flexibility of its open architecture also means you aren’t locked into a single software ecosystem, meaning you can choose the pieces of your tech stack that meet your needs and budget.
Conclusion
SAS Visual Investigator is well adapted for much investigation work, with good features for case management and working with teams of investigators. However, it can be difficult for less experienced users to get up and running on the software. It may also not be well adapted for use cases that require advanced and complex data exploration. And, it comes at a higher price than an alternative tool like Linkurious Enterprise.
Linkurious Enterprise can be a good solution for you and your team if you require a solution that can scale easily, and if you want flexibility that allows you to integrate your investigation tool with the rest of your tech stack. Linkurious Enterprise is also an ideal solution for users without technical expertise.
Learn more about Linkurious Enterprise and get a demo to see it for yourself.
(1) https://neo4j.com/whitepapers/gartner-top-trends-data-analytics/
A spotlight on graph technology directly in your inbox.