Investigating a money laundering scam
Following the money is a good way to fight criminal organizations and uncover money laundering scams, but it can be a big challenge. Gangs, white-collar criminals or terrorists can create complex circuits to launder their money. Investigators have to map these circuits in order to bring down the criminals and graphs can help them.
The challenges of investigating money laundering scams
Money laundering is the process by which the proceeds of crime are transformed in a way that conceals the money's criminal origins. It generally involves 3 phases : placement, layering and integration.
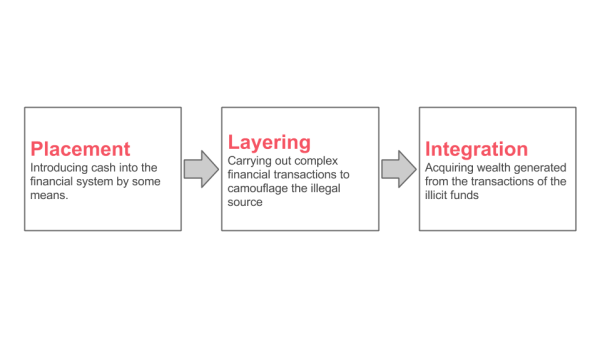
For investigators and analysts, investigating a money laundering scam means following the money trail through each of these phases. Each phase may in itself also involve several steps.
Investigations also require a lot of documents and data: transaction histories (which may include international transactions), account information across several jurisdictions, information on businesses that might be involved, and more.
Even when investigators can access the records, they still have to piece them together to build a comprehensive view of the money laundering scam. How to track connections and entities across thousands of documents or more? That’s where graph visualization can help.
To demonstrate that, we are going to look at the example of a criminal organization that launders the proceeds of its drug money.
Money laundering and network visualization
We have prepared a small dataset that emulates the kind of information anti-money laundering investigators use. In our data we have 3 distinct types of entities:
- individuals
- companies
- bank accounts.
Money flows from one bank account to another. People or companies control bank accounts. This can be summed up in the following diagram:
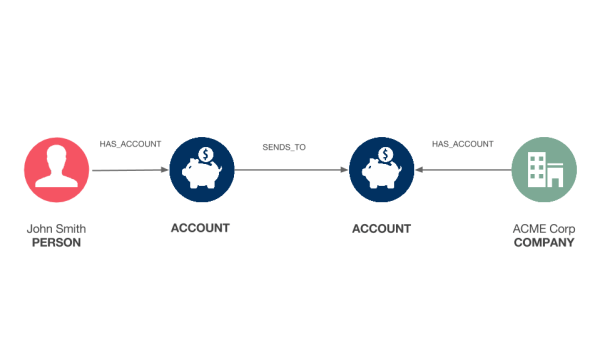
John Smith owns a bank account that is used to transfer money to a bank account controlled by Acme Corp. The picture makes it possible to understand at a glance how these 4 entities are connected. The same information could be communicated via a text or a spreadsheet but it would be more difficult to analyze and take longer to understand. In contrast, graph visualization helps quickly understand complex connected data. For investigators and analysts, that means less time spent retrieving data and more time analyzing it.
Investigating and visualizing the money laundering scam
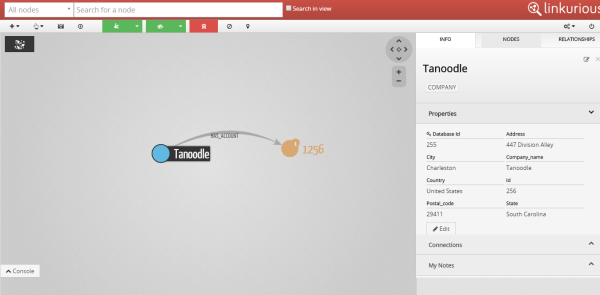
An investigator may be tasked with investigating a criminal organization. In this example, the organization's leaders are Virginia Parker, Marilyn Meyer and Diane Lawson. They are suspected of running a large drug operation. One way to bring them down is to look for their money and seize it. The only information we have at the start of the investigation is that a known associate of the organization runs a small business called Tanoodle.
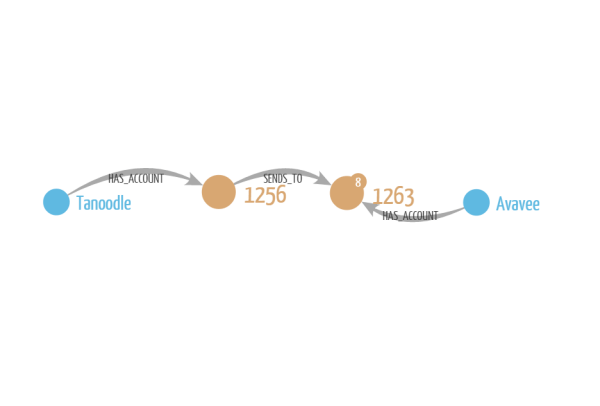
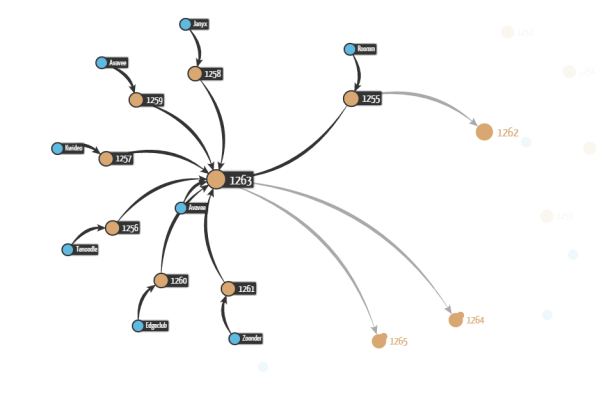
By investigating the records of Tanoodle, we can see that it funnels money to a recently formed company, Avavee.
It is worth learning more about that new company. A legal inquiry into Avavee leads to more financial records. These records help complete our graph. We can see that Avavee receives money from 6 previously unknown companies and it funnels money to two companies, Digitube and Zava.
We started with a single company and by following the path of its money we have found a web of companies it is connected to. Furthermore that web is clearly structured. A first layer of 11 companies are funneling money to two companies (Avavee and Youspan) which in turn are funneling money to two other companies (Digitube and Zava). They are all interconnected.
This layering approach is used by the criminal organization to obfuscate money flows. But through careful mapping, we can follow the funds from their inception to Digitube and Zava.
Upon further investigation, we are able to collect information about Digitube and Zava. They are sending money to two bank accounts. This helps us build a complete picture of the money laundering scam at the center of the criminal investigation.
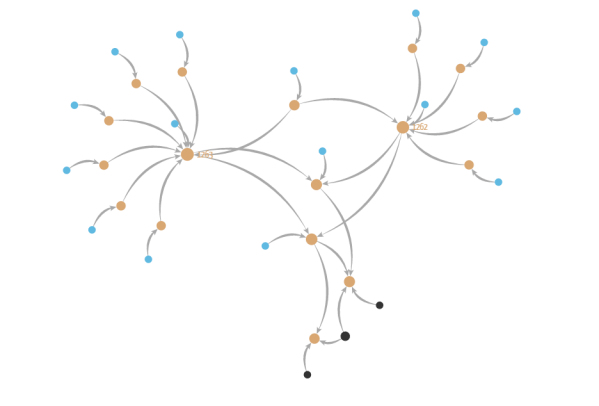
The graph visualization makes it easy to understand the money laundering scam, who it involves and their roles:
- We have 2 distinct layers between the organization bosses and the lowest level
- 17 bank accounts, 15 companies and 3 persons are involved in the scheme.
It looks like money collected from illegal activities is injected into small businesses. The money is then transferred through two layers of companies before being deposited into bank accounts controlled by the bosses of the criminal organization. The graph represents the data accumulated during the investigation and can be used to communicate ti to third parties (banks, prosecutors, etc).
Graph visualization is a powerful tool for investigators working on money laundering cases. Combined with the fraud detection capabilities of graph databases, it can deliver real results. Watch our demo to see how Linkurious Enterprise can help you make sense of the connections in your data!
Learn more about graph visualization and AML
Download our ebook to learn more about key challenges facing financial institutions and how next generation analytics help connect the dots and stop criminals in their tracks.
A spotlight on graph technology directly in your inbox.