GRAPHVIZ 101: INTERACTION AND DATA MINING ALGORITHMS
Graph Viz 101 is a series of posts to teach the basics of graph visualization, written by Sébastien Heymann in collaboration with Bénédicte Le Grand of Université de Paris 1. This is our seventh post, please discuss it below!
Reaping Benefits from Data Mining Algorithms
Visualization is part of a larger process to extract insights from data, as we have seen in our previous post. The exploration of complex networks implies the study of collected data, but this data may not be sufficient to quickly perform some visual analytics tasks, such as identifying the shortest path between two nodes. A solution to this problem is to augment data with the results of data mining algorithms, then to integrate them into visualizations.
For instance, consider the identification of all communities of the network, i.e. the groups of nodes with dense connections within groups and sparser connections between groups. The Louvain community detection algorithm (Blondel 2008) may be used to find one partition of the graph which maximizes a given quality function (modularity) of the communities. Because this algorithm detects non-overlapping communities, each node is assigned to exactly one community. Analysts can then assign a node color according to the community the node belongs to.
In another example, we consider the identification of the most central edges, where a central edge is defined as an edge traversed by the greatest number of shortest paths. One may compute all shortest paths using the algorithm of (Brandes 2008) and map its result to lines thickness in the node-link diagram.
In a last example, consider the detection of someone’s “influential social circles” (where the influence is let to be defined by the analyst) in a social network. A possible method consists in filtering (Ahlberg 1994) the network to highlight the nodes surrounding a selected node. But too many nodes are displayed if the node (or its direct neighbors) has a high number of connections. A solution is to define a function usually called “degree of interest” (Furnas 1986), which computes a score of how each node is related to the selected node, then to prune the visualization by keeping only the nodes of highest score. This method was used in (van Ham 2009) in another context.
Data mining algorithms may also be executed by interacting with the representation, like computing the shortest path after having selected the path endpoints. Integrating these algorithms into the visualization and making them available at any time of the exploration is thus a solution to include them in the non-linear processing chain.
Interaction
The quantity of information displayed by visual representations is naturally limited by the properties of the medium, such as the paper size and the resolution of screen devices, i.e. the number of points that can be displayed in the two dimensions. When neither the size nor the resolution can be increased, a solution to overcome this issue on screen is to interact with the representation so that one can display information on demand. This approach helps to improve the readability of visualizations by reducing the quantity of displayed information at a given instant.
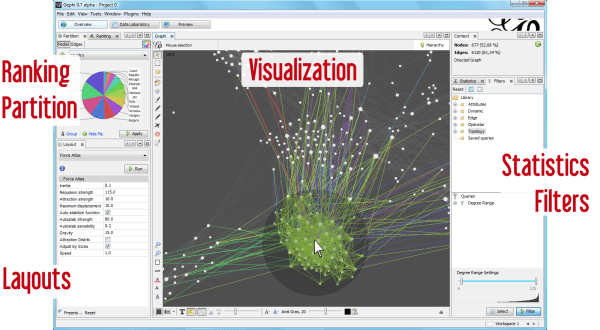
 A set of interaction techniques using the mouse has become a standard: node selection on mouse click (see illustrations above), node drag-and-drop to move its position, zoom and pan navigation features with the mouse wheel. These features are shared by noticeable software for the visual analysis of complex networks such as Cytoscape, Gephi, SocialAction and Tulip.
Moreover, advanced interaction techniques can enhance analysis tasks. For instance, Gephi proposes to follow the shortest path from a node to another by clicking on the source node and on the target node, then coloring edges along the path. However, interaction techniques are bound to visual representations and are therefore difficult to generalize (Auber 2012). New technologies of Human-Computer Interfaces like multi-touch screen devices provide also new area of innovation (Schmidt 2010).
Finally, interaction can be used not only to explore a dataset, but also to command the other steps of the processing chain. For example, one may filter the network according to a given query based on the properties of nodes and edges, such as “display the nodes of degree greater than 10” (Adar 2006). One may also acquire new data by interacting with the representation, as it is the case on visual Web crawlers: crawlers are programs which grab the content of Web pages by recursively visiting the hyperlinks of given Web pages. One can encode Web pages as nodes, and hyperlinks as edges. The corresponding node-link diagram represents the Web explored by the crawler. One could then ask for the crawler to visit the hyperlinks of a Web page by double-clicking on its corresponding node. The crawler would therefore retrieve the new Web pages and scan the new hyperlinks available, to update the visualization.
Interaction techniques are therefore essential to explore large networks, to speed up analysis tasks, and to integrate visualization in the data processing chain. However, time-varying networks raise specific challenges that we will cover in a following blog post
A spotlight on graph technology directly in your inbox.