Data contextualization: Get valuable insights from your data with the help of graph technology
Businesses across industries are inundated with huge amounts of information in today’s data-driven world, making it increasingly challenging for data scientists to sift through the noise and extract meaningful insights. Data in its raw form often lacks the necessary context to unveil its true significance. This is where data contextualization comes into play – a transformative approach that empowers data scientists to unravel the hidden stories within complex datasets to gain valuable information and drive better decision making.
At the heart of data science, data contextualization involves understanding information within its relevant context, transcending the boundaries of conventional data analysis. By delving deeper into the relationships and connections that underpin data, organizations can extract actionable intelligence and gain a competitive advantage in their respective industries.
In this article, we’ll explore the concept of data contextualization, look at its value for businesses, and discover how graph technology plays a pivotal role in its implementation, enabling businesses to thrive in an era defined by information abundance and complexity.
What is data contextualization?
First things first, let’s quickly define what we’re talking about when we refer to data contextualization. In the realm of data science, data contextualization stands as a crucial pillar that empowers analysts and businesses to derive meaningful insights from the vast ocean of information at their disposal. It goes beyond conventional data analysis by placing data within its relevant context.
Data contextualization essentially aims to bridge the gap between raw data and actionable intelligence. While data in its unprocessed state may appear disjointed, its true value lies in the relationships and connections within. By contextualizing data, data scientists can paint a detailed picture of how each piece of information interconnects with and influences the others, shining a light on deeper insights that might otherwise remain hidden.
Why data contextualization matters
Data contextualization serves to uncover the underlying patterns, trends, and anomalies that lie in your business operations. Without context, data risks losing its relevance and meaning, leading to misguided decisions and missed opportunities. Take the example of supply chain optimization: data around shipping times and individual suppliers are of limited use when considered in isolation.
But by contextualizing data with geographic information, performance data, information on customer demand, and more, businesses can gain a comprehensive view of their supply chain performance and make informed decisions to reduce risk and make further improvements.
The value of data contextualization for businesses
As data continues to grow in volume and complexity, data contextualization becomes an indispensable practice for enterprises seeking to stay ahead in their respective industries. By embracing data contextualization, businesses stand to gain a lot:
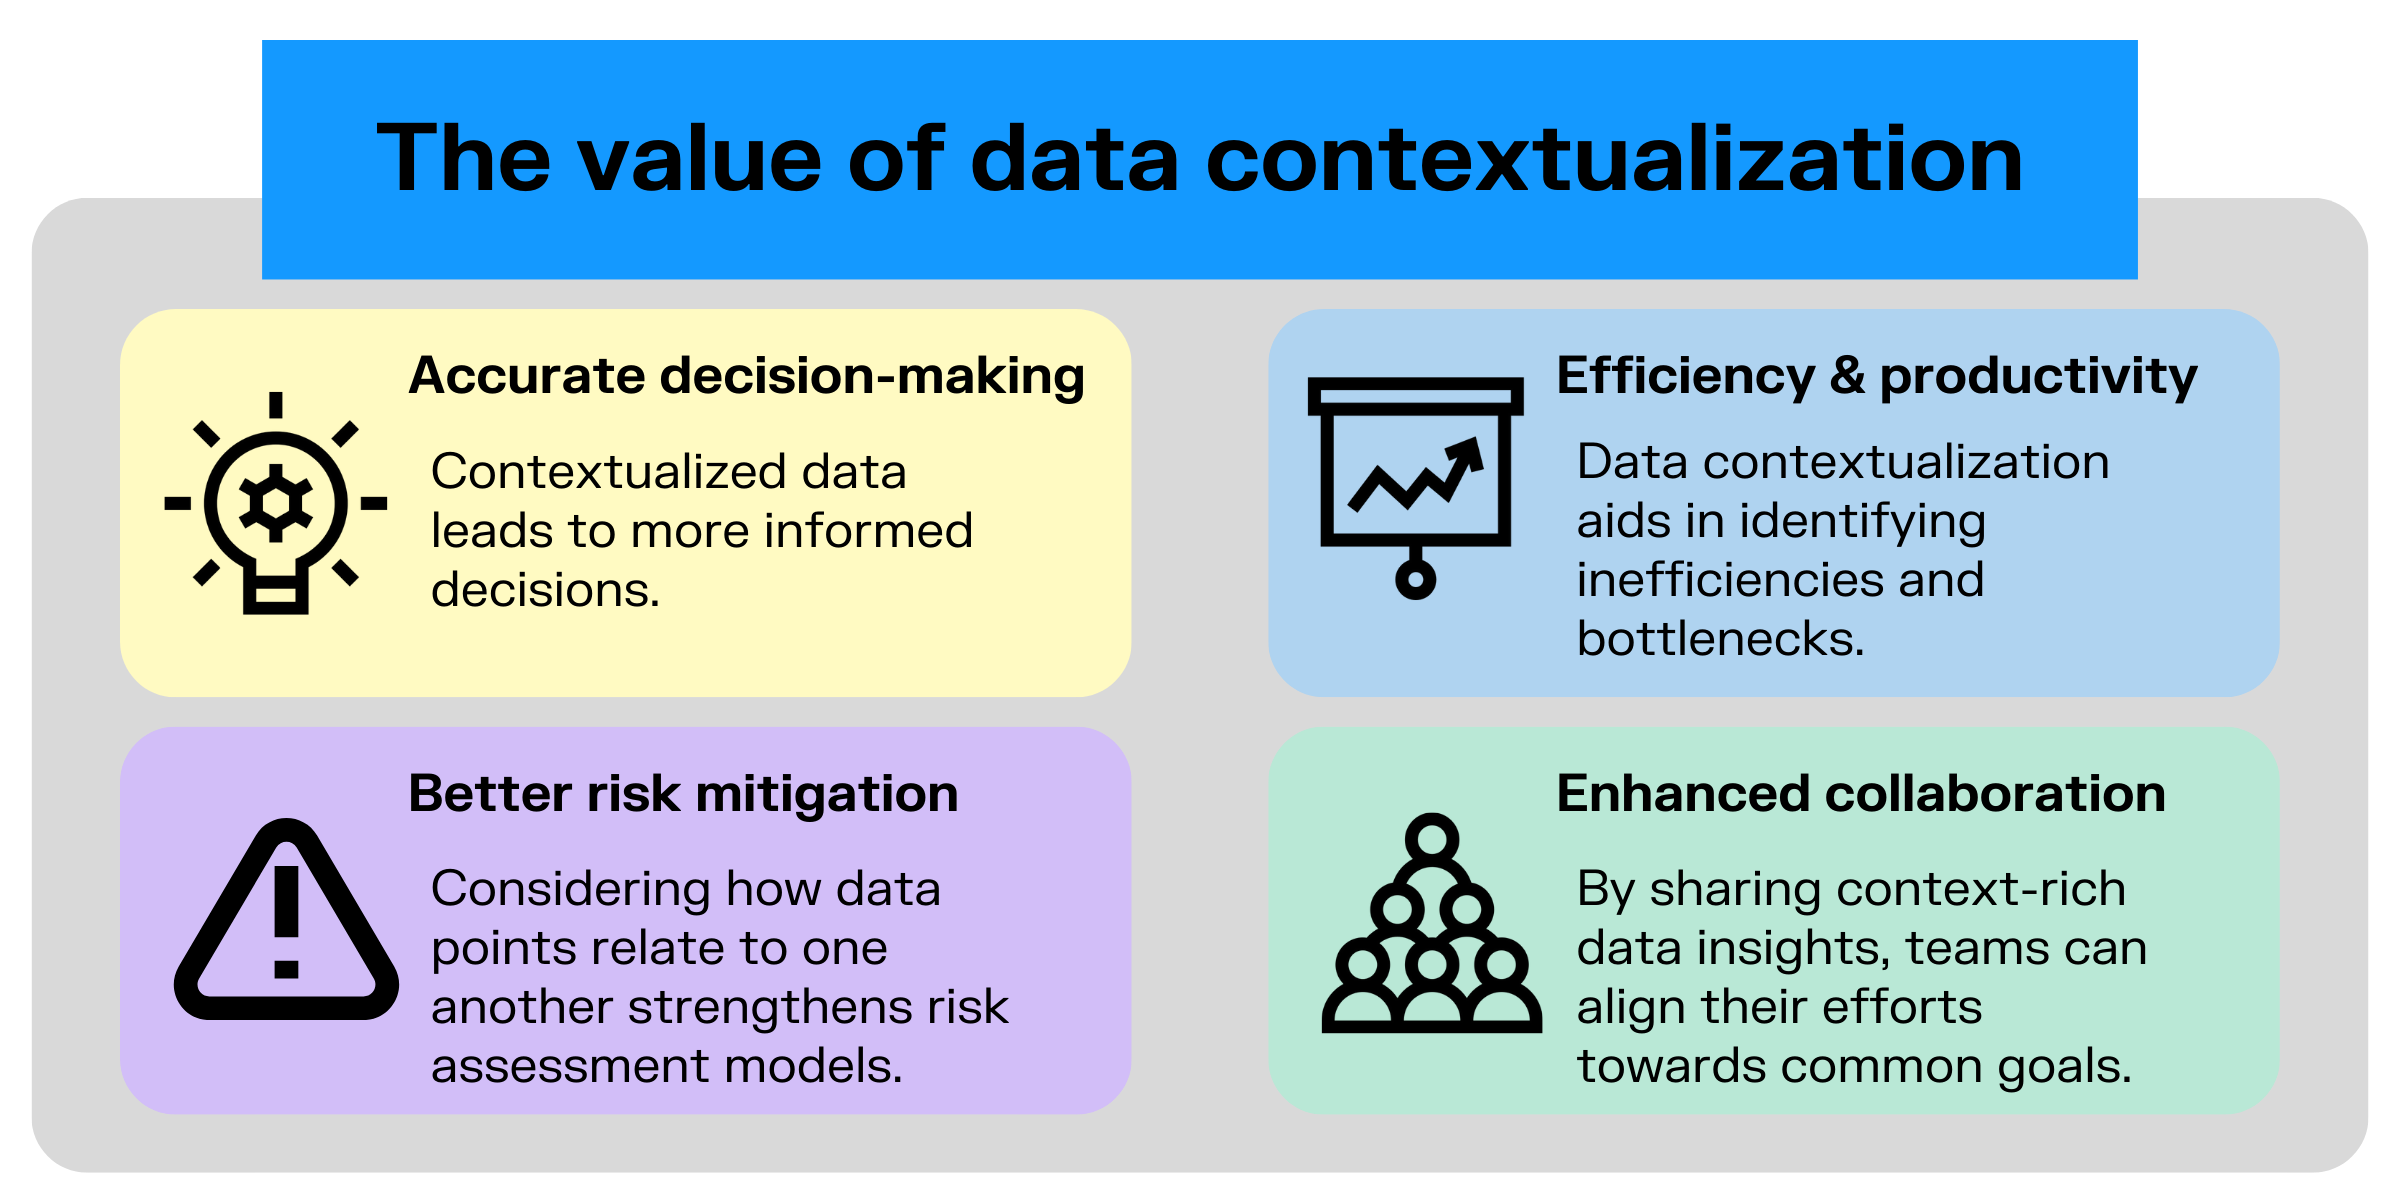
- More accurate decision-making: Contextualized data leads to more informed decisions, enabling organizations to respond swiftly and confidently to dynamic market conditions and challenges.
- Improved efficiency and productivity: Data contextualization aids in identifying inefficiencies and bottlenecks within processes, paving the way for streamlined operations and increased productivity.
- Better risk mitigation: Data contextualization strengthens risk assessment models by considering a wide range of data points and how they relate to one another. Whether it’s financial transactions or cybersecurity incidents, contextualizing data helps detect anomalies and patterns indicative of potential risks or fraudulent activities.
- Enhanced collaboration: By sharing context-rich data insights, teams can align their efforts towards common goals and make collective decisions based on a comprehensive understanding of the business landscape.
Data contextualization serves as a compass, guiding businesses through vast seas of data and providing the clarity needed to navigate the complexities of the modern world. By embracing this transformative approach, data scientists and businesses can unlock the true potential of their data, harnessing its power to fuel growth, innovation, and success.
Graph technology: A must-have for effective data contextualization
As businesses grapple with voluminous datasets, traditional data management solutions struggle to keep up with the complexity and nuances of data contextualization. Graph technology is a game-changing asset for data scientists to meet the challenge. Graph technology offers a powerful framework for representing and analyzing data in context, enabling not only data professionals but also business users to understand even very complex relationships and discover hidden insights that might remain elusive with conventional databases.
Graph technology represents data as interconnected entities. In a graph, individual data points are represented by nodes, and edges represent the relationships between nodes. Graph technology embraces the importance of relationships and treats them as first-class citizens. This makes it particularly well suited for data contextualization, as understanding the relationships between various data elements is crucial for unveiling deeper insights.
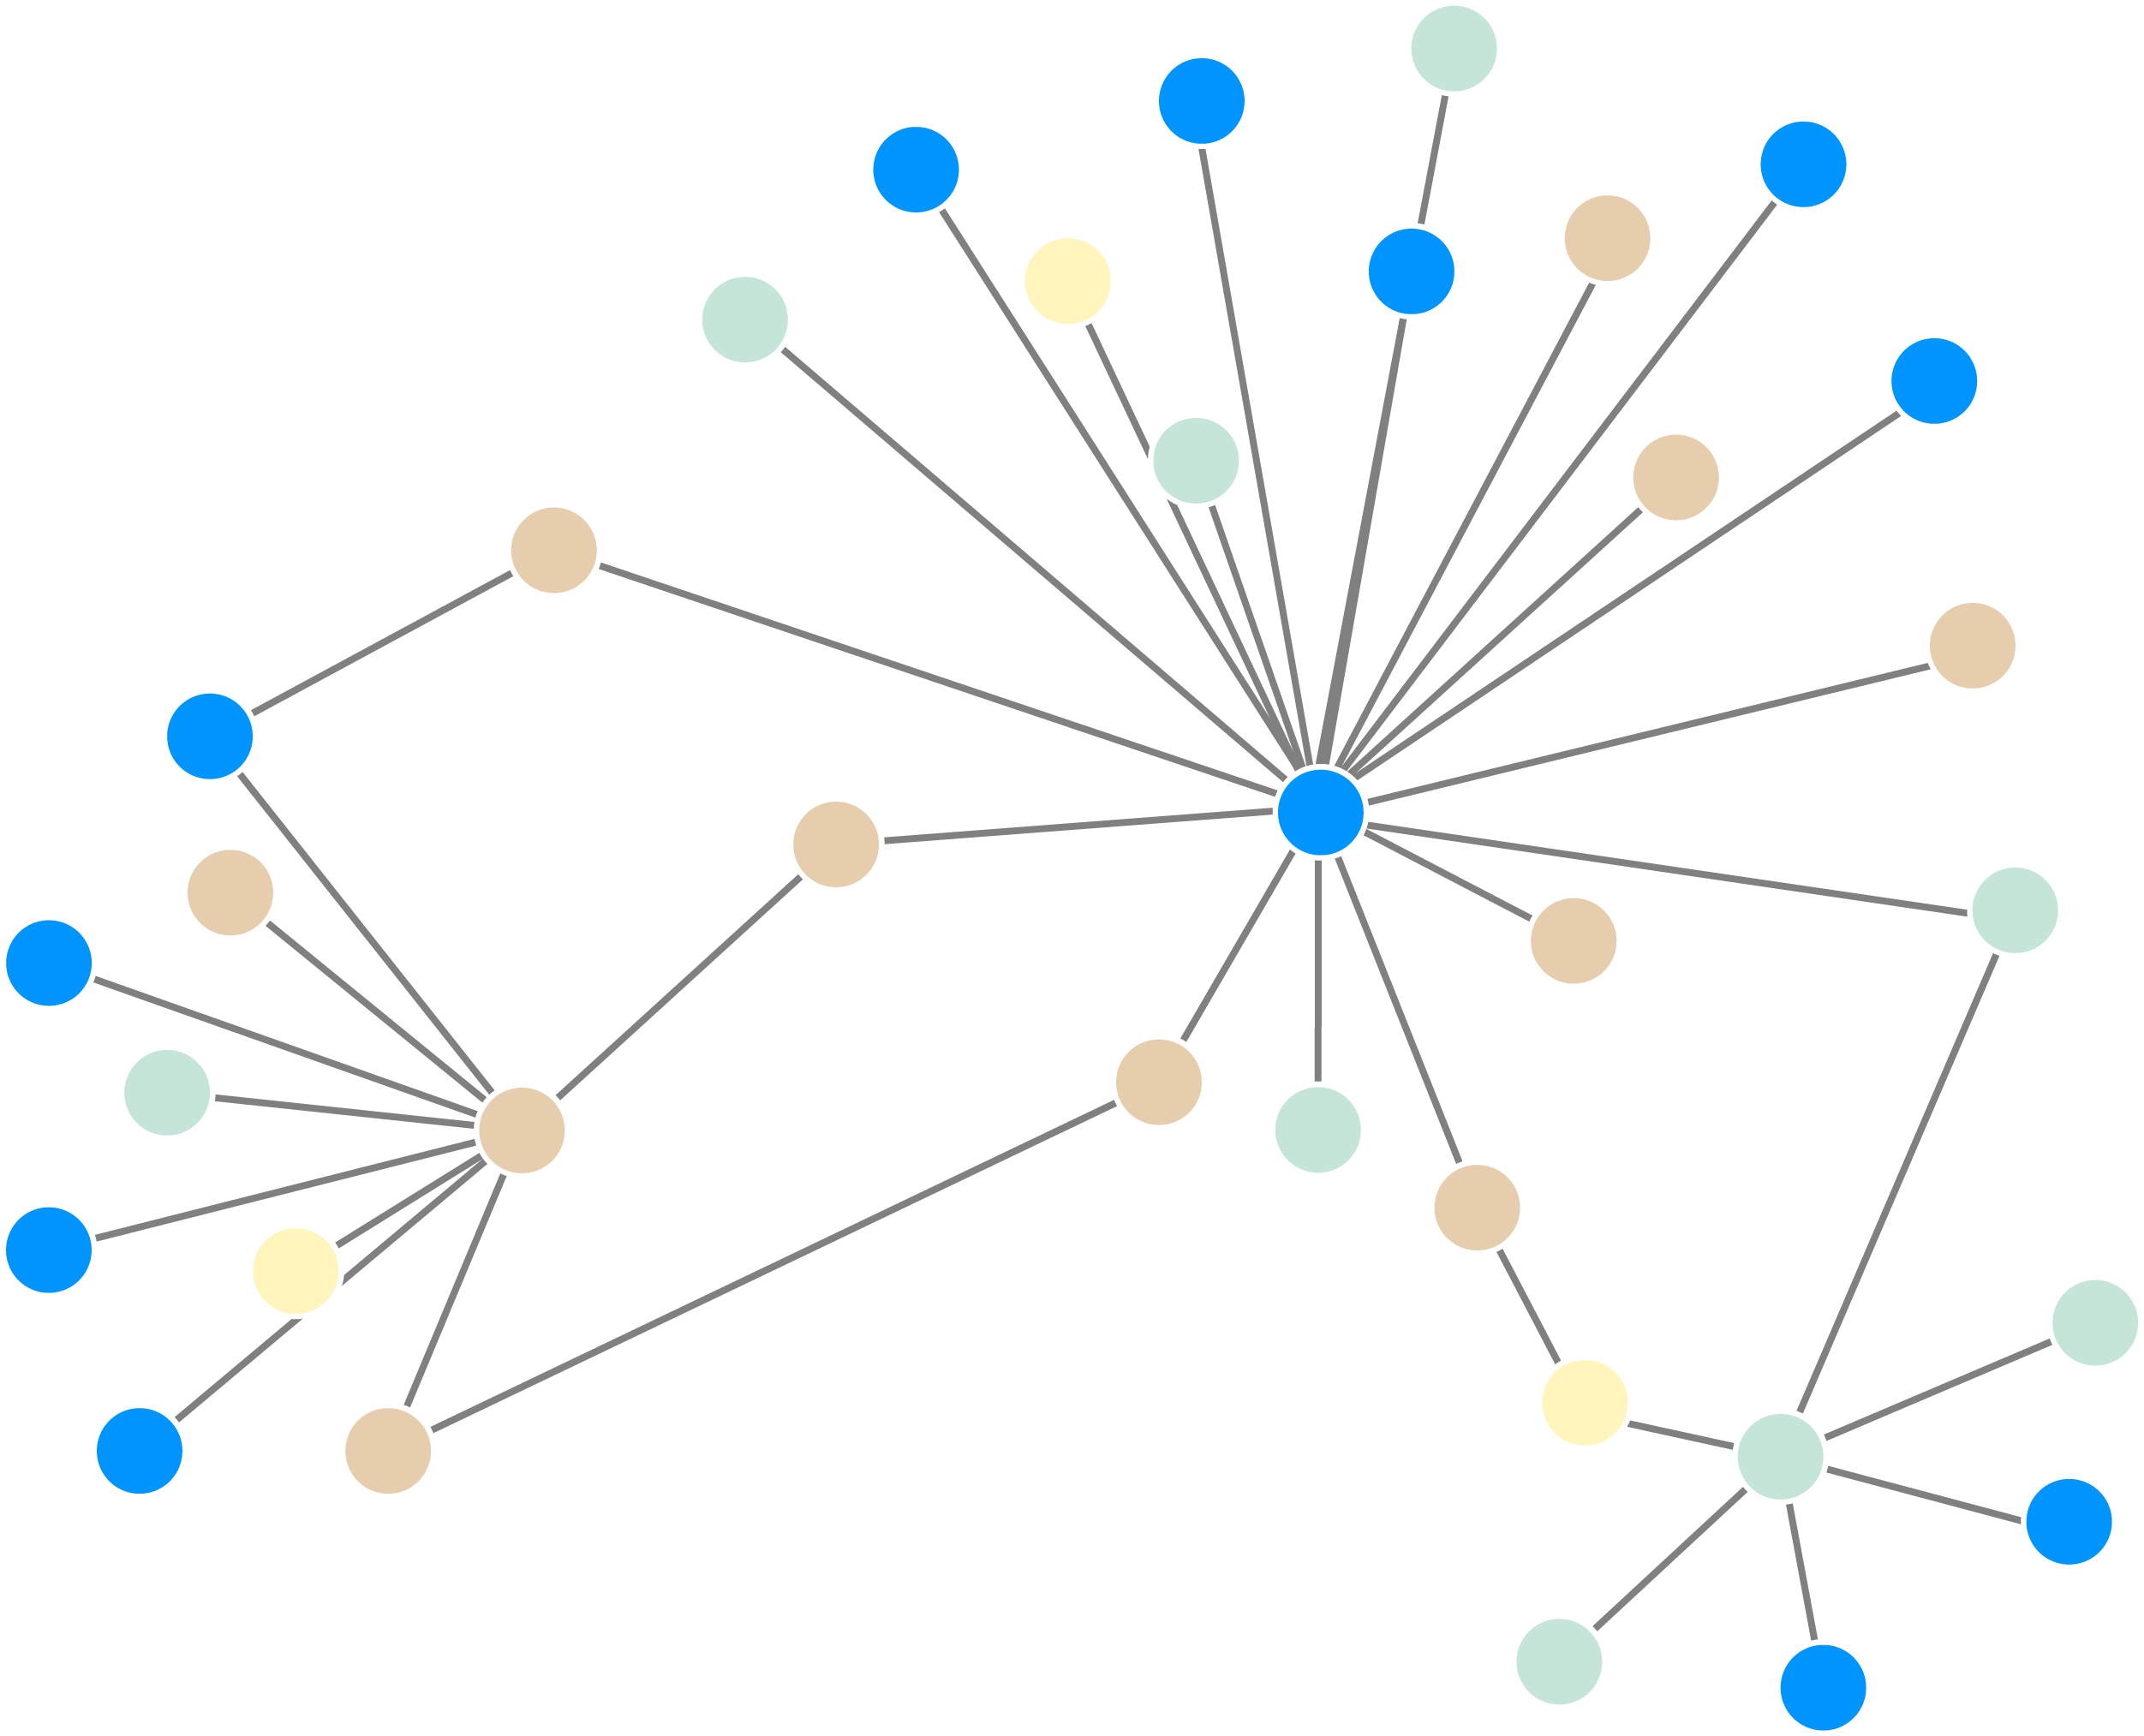
Graph technology excels in navigating complex data networks. Data scientists can traverse the graph, following relationships, and uncovering direct or indirect connections that provide comprehensive context to individual data points at multiple levels. This allows for in-depth analysis and a holistic understanding of data, making it easier to identify patterns, trends, and dependencies.
Discovering hidden insights
By analyzing their data as a graph, using graph algorithms and queries, data scientists can unearth hidden insights that would be difficult to discover using other methods. Graph algorithms can identify influential nodes, detect clusters of interconnected data, and find shortest paths between critical data points, all of which contribute to a richer understanding of the data in context.
Graph technology is a powerful enabler of data contextualization, allowing data scientists to explore and interpret data in its full context. With its ability to represent relationships and navigate complex networks, graph technology emerges as an indispensable tool in the data scientist's arsenal.
Conclusion
In the dynamic landscape of data science, data contextualization has emerged as a critical practice that empowers businesses to unlock the true potential of their data. By understanding information within its relevant context, data scientists can derive deeper insights, leading to informed decision-making, better risk mitigation, and enhanced operational efficiency.
To embark on this transformative journey, graph technology has emerged as a valuable asset. Graph technology's ability to represent complex relationships and navigate interconnected data opens new vistas of knowledge and understanding.
Ready to get a deeper contextual understanding of your data? Natively built on graph technology, Linkurious Enterprise enables you to interactively visualize and analyze your graph data, intuitively navigating its intricacies to uncover the rich stories it holds. Discover the hidden relationships, identify critical patterns, and gain a comprehensive understanding of your data's contextual landscape - all before lunch. Try it today.

A spotlight on graph technology directly in your inbox.