Visualizing the European R&D network
The European Union spends billions of euros to fund R&D projects. Who benefits from that money? To answer that question, we have worked with Kenedict Innovation Analytics, a Dutch firm specialized in applying network analytics to innovation-related data. Let’s dive into the European research ecosystem!
The European R&D network
Every year, the European Union invests billions of euros to stimulate R&D across the continent via the Framework Programme for Research and Technological Development. The seventh installment (FP7) ran from 2007 to 2013 and had a budget of just over € 50 billion. The money is spread across 5 sub-programs. It is spent on grants to research actors to co-finance R&D projects. FP7 is now closed and data about the projects and companies involved in it is available publicly.
That data gives a glimpse into the state of R&D cooperation in Europe. We are going to use graph visualization to discover key actors, projects and groups within the European research ecosystem.
The European Union Open Data Portal provides one CSV file for the projects, one CSV file for the organizations involved in FP7. The information contained in these files can be summed up in this schema:
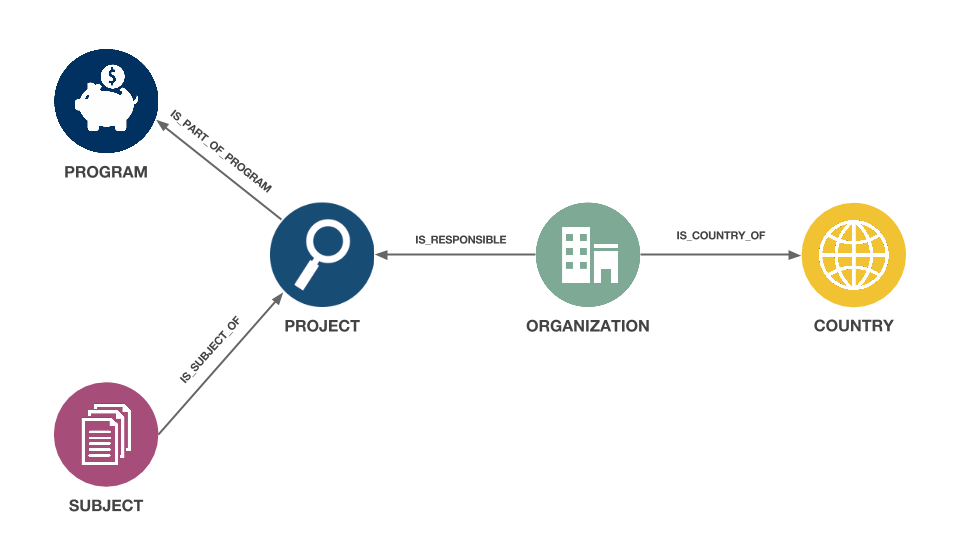
Projects have a theme and are attached to one program. Multiple organizations collaborate on a given project. Each organization belongs to a country. In our graph we have 33 373 organizations, 26 042 projects representing a budget of 43 747 454 450€.
We have detailed information for each project including its budget, how much it received from the EU, its start date, its end date and its title.
In order to analyse the data, we are going to load it in a Neo4j graph database with this script:
Now the data can be searched, explored and visualized through Linkurious.
The biggest R&D projects and organizations in Europe
First of all not all projects attract the same level of cooperation. Through Cypher, the query language of Neo4j, we can identify the projects with the most participants.
//———————–
//Project with the most relationships with organizations
//———————–
MATCH (a:ORGANIZATION)-[r:IS_RESPONSIBLE_OF]->(b:PROJECT)
RETURN b, count(r) as count, collect(a.organisationName) as names
ORDER BY count DESC
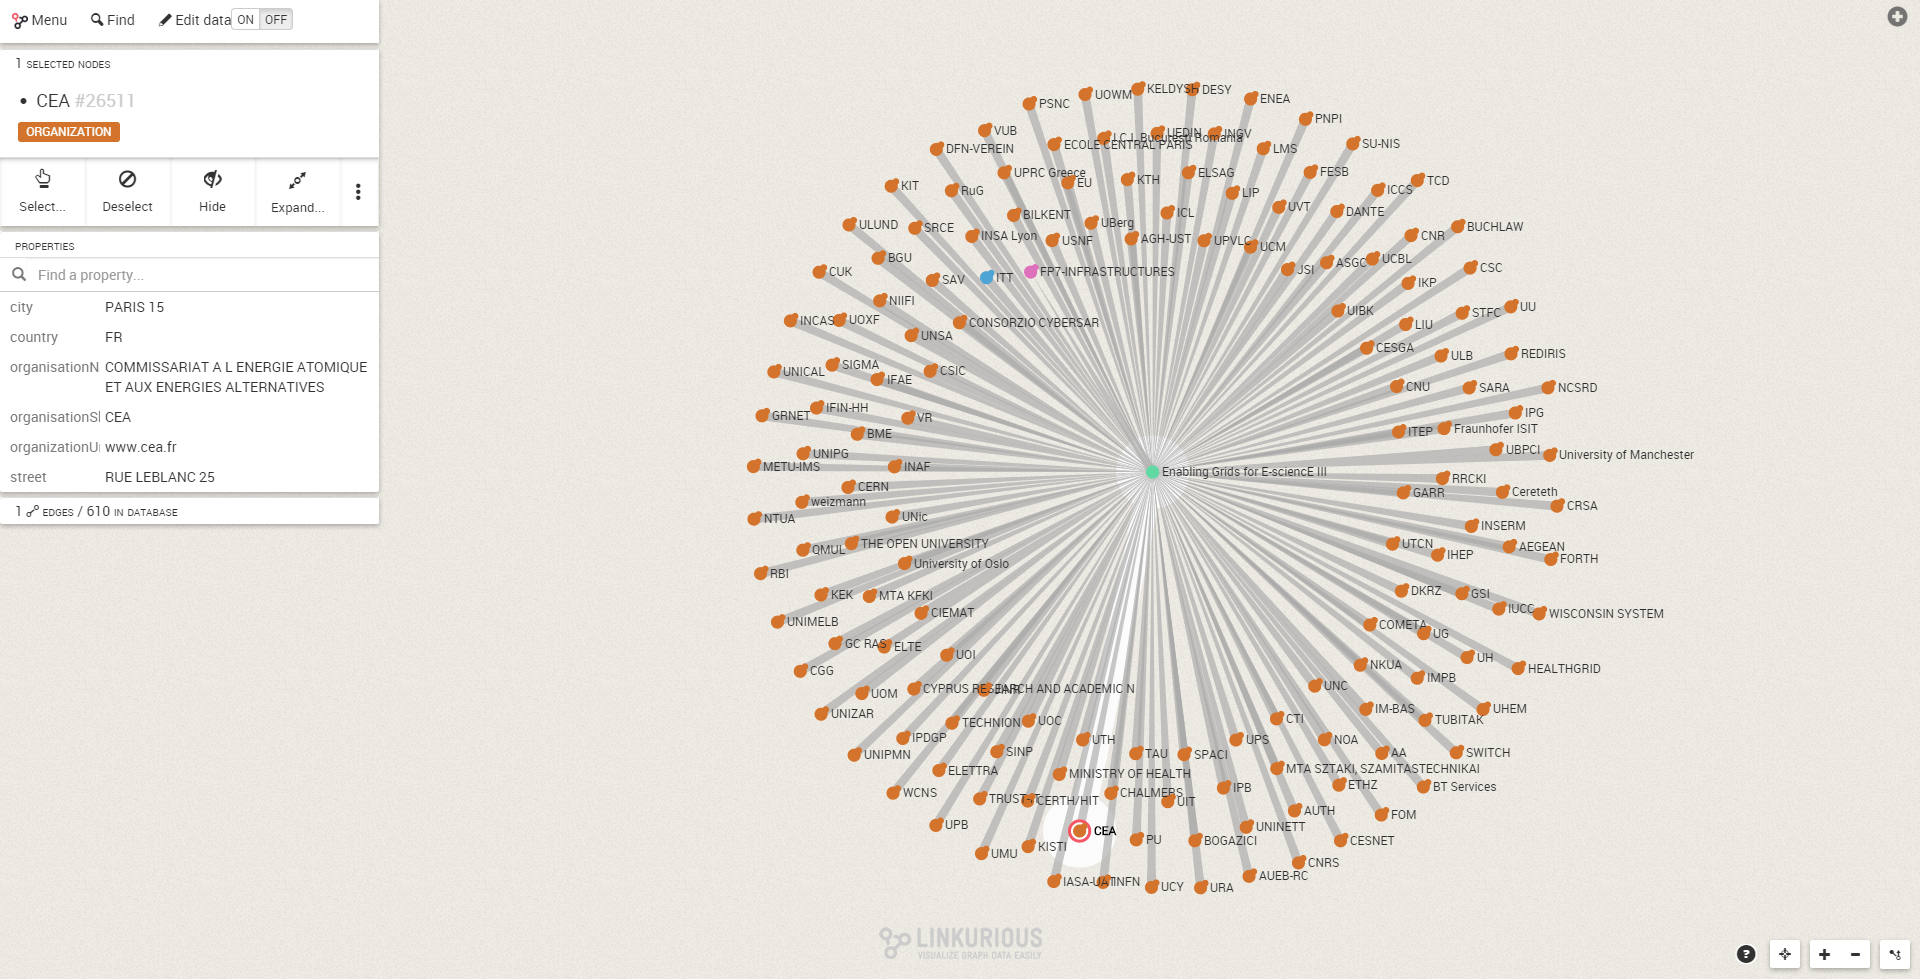
LIMIT 10The “Enabling Grids for E-sciencE III” project is the biggest project of FP7 with 160 organizations participating in it and a budget of 49M€.
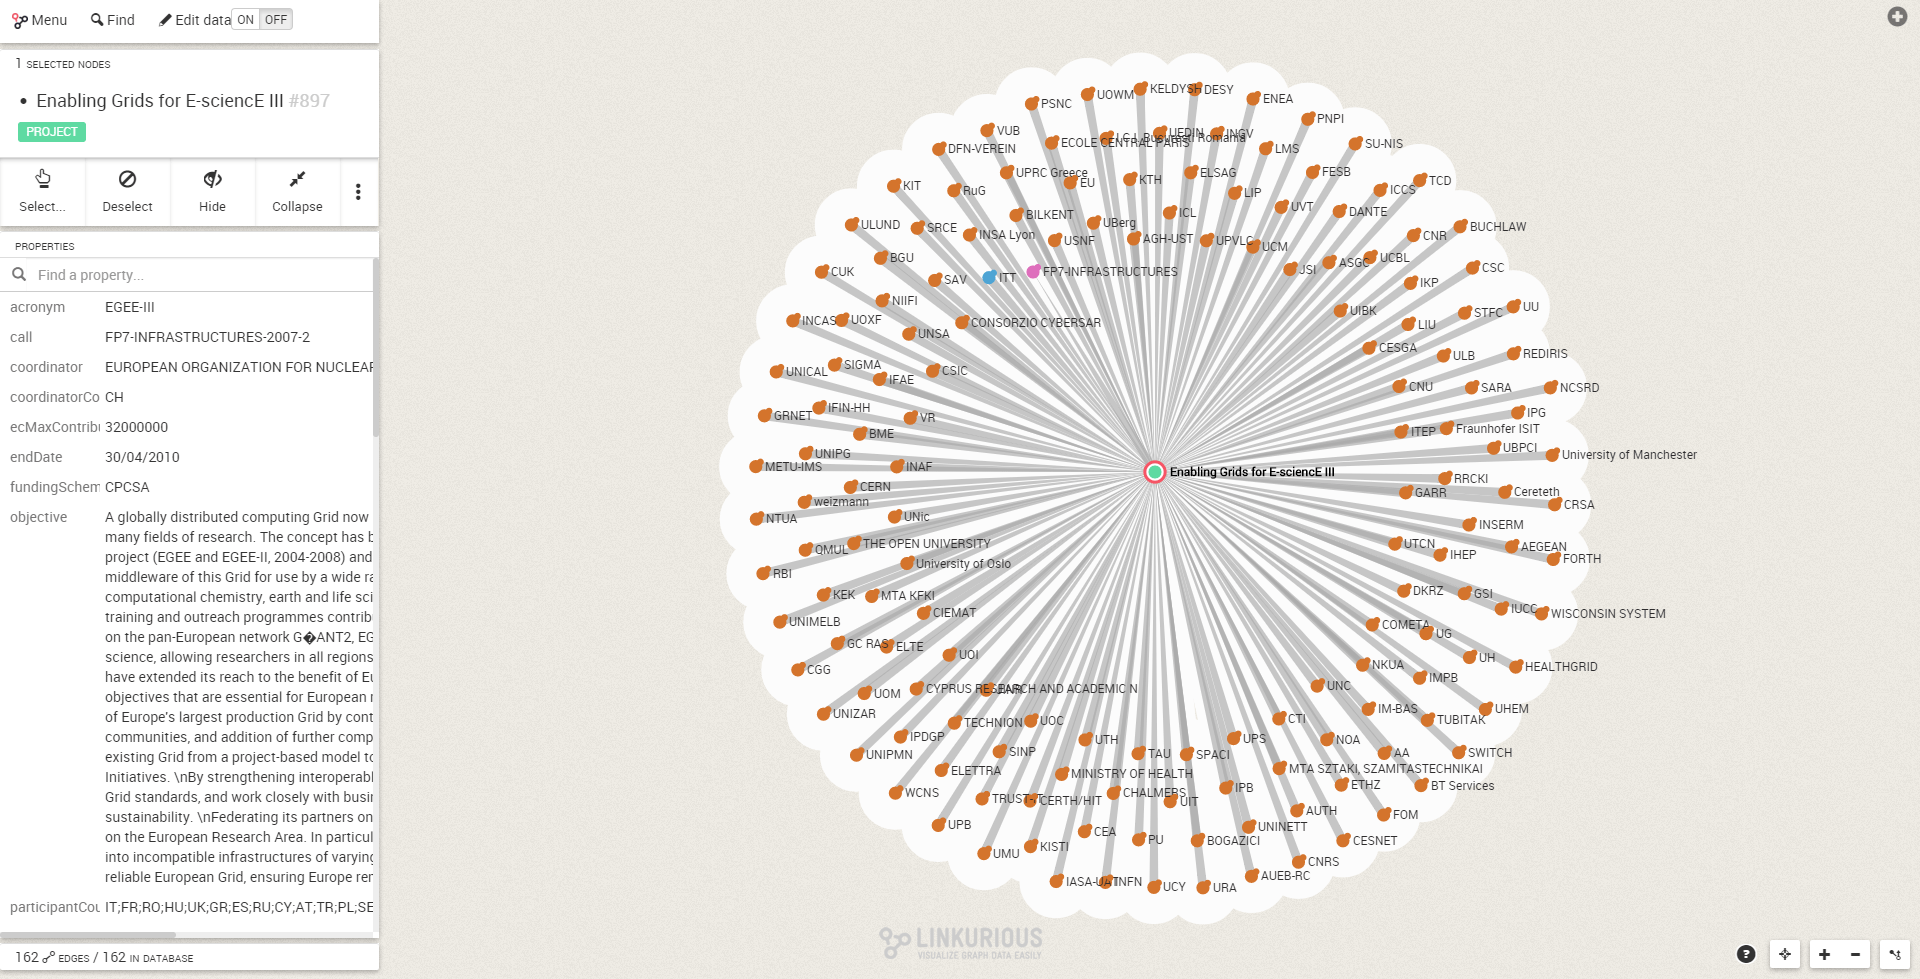
Among these organizations, there is for example the CEA, the French Commissariat à l’énergie atomique et aux énergies alternatives.
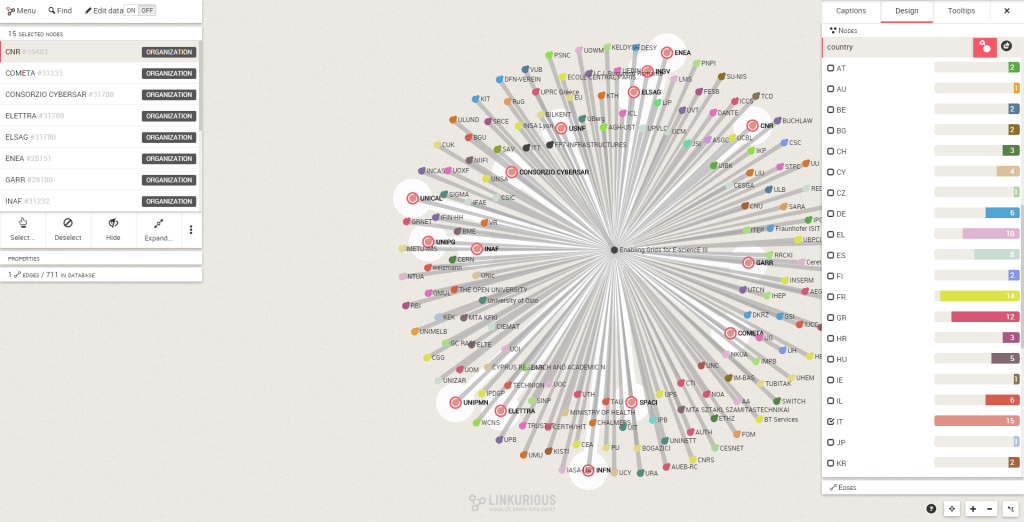
By coloring the organizations according to their country, I can quickly identify that Italian and French organizations are the most involved.
Want to know which organization is involved in the most projects? Easy enough with Cypher.
//———————–
//Which organizations are involved in the most projects?
//———————–
MATCH (a:ORGANIZATION)-[r:IS_RESPONSIBLE_OF]->(c:PROJECT)
RETURN a, count(r) as count
ORDER BY count DESC
LIMIT 10
Public research institutions benefited the most from FP7. The French CNRS for example is involved in 1383 different projects. The German Fraunhofer Institute is involved in 1148 projects.
In the pictures above, the size of the nodes represent the budget of the projects (the bigger the node, the bigger the project’s budget).
Cooperation in FP7-Environment
Now let’s try to identify the projects that foster collaboration. For that part of the analysis we are going to focus on FP7 Environment, a program addressing global environmental issues like climate change.
Let’s start by identifying the organizations that collaborate the most with each other.
//———————–
//Which organizations share the most projects?
//———————–
MATCH (a:ORGANIZATION)-[:IS_RESPONSIBLE_OF]->(b:PROJECT)<-[:IS_RESPONSIBLE_OF]-(c:ORGANIZATION)
RETURN a, c, count(b) as affinity
ORDER BY affinity DESC
LIMIT 10
With that query we can see that the CNRS, the leading French research institution collaborate on 16 projects with the German Max Planck Society.
This is a deep relationship between two organizations from France and Germany. The organization which has relationship with the most other organizations is from Italy though.
//———————–
//Which organizations is collaborating with the most organizations
//———————–
MATCH (a:ORGANIZATION)-[:IS_RESPONSIBLE_OF]->(b:PROJECT)<-[:IS_RESPONSIBLE_OF]-(c:ORGANIZATION)
RETURN a, count(c) as score
ORDER BY score DESC
LIMIT 10
The Italian CNR has ties to 1139 organizations through 65 distinct projects.
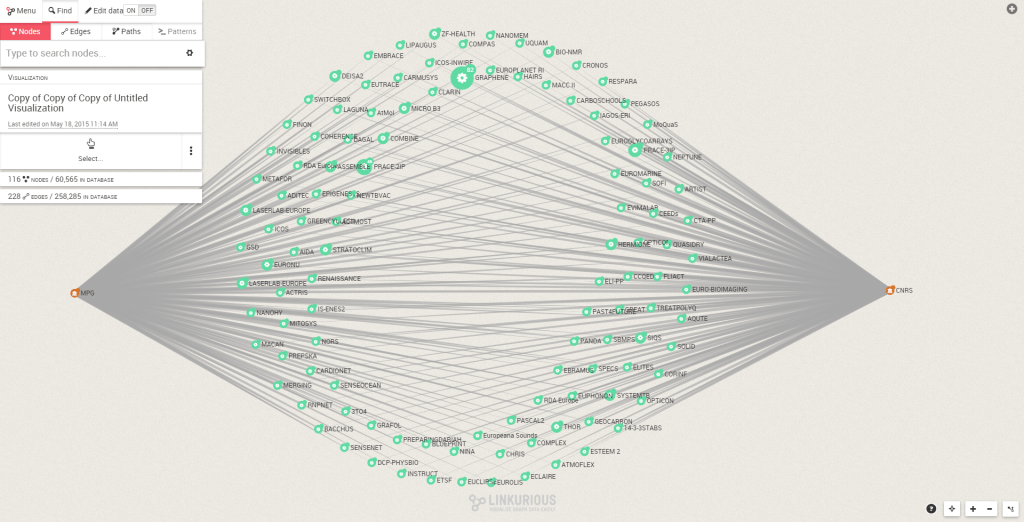
To get a view on the interconnectivity between all organisations who were active in FP7 Environment projects, it is also worthwhile to take an interactive look at (subsets of) the whole network. This will allow us to immediately see which other organisations play important roles next to the Italian CNR.
Our data shows that a total of 495 projects were carried out as part of the Environment programme. When we assume that organisations are connected to each other when they co-participated in a project, the full network includes 2,974 organizations and 47,360 connections between them. Since the FP7 data sometimes includes multiple ways of referring to the same organization (for instance ‘Centre National de la Recherche Scientifique’ and ‘CNRS’), we cleaned organization names to try and make sure there are no duplicate entities in the network.
Let’s first take a look at the most connected organizations in terms of their number of connections. In the visualization below, larger nodes have most connections; overall, it shows the 172 organizations with 100 or more connections. Purple nodes are universities and other higher education institutions; cyan nodes are public research organisations; green nodes are other public bodies; and red nodes are privately owned companies.
What we are actually seeing here is the very dense core of the network, consisting of all the organizations which have worked with at least 100 or more other organizations from 2007 to 2013. What’s very interesting here is that almost the entire core is dominated by universities (51% of nodes) and research organisations (44% of nodes). The only 3 private companies we see are the French Veolia, the Dutch KWR Water and the Spanish Acciona. The overall interconnectivity here partly relates back to a total of 52 organisations participating in the project ‘Policy-oriented marine Environmental Research in the Southern European Seas’, which received funding of approximately € 13 million.
A measure of success for organisations participating in FP7 projects could relate to the number of times they acted as a project coordinator. One interesting question which arises in this context is whether the best connected organisations are then also more inclined to be the coordinator on a project. From the visual above, it is pretty easy to distinguish which organisations are leading in terms of connections. Which are leading in terms of attracting project coordinatorship?
In the table below, we see that the Dutch Dienst Landbouwkundig Onderzoek (Agricultural Research Service) leads the pack by coordinating a total of 11 projects. Are we able to find all these organisations in the network’s core as well? Using the search function accompanying the visual, we indeed see that nine out of ten appear in the core as well. Just the Barcelona-based CREAL is missing, and occupies a position elsewhere in the network.
Even though private companies (either corporates or small- and medium-sized enterprises (SMEs)) are not very well represented in the core, they do play an important role in terms of overall activity in Environment-related projects. Let’s focus solely on these and see how they are connected amongst each other. Here, cyan nodes are corporates and red nodes are SMEs. The larger a node, the more it occupies a bridging position between various sub-clusters of collaborating organizations, as denoted by its betweenness centrality:
We see the three companies mentioned above appearing again, this time holding key positions in binding together various smaller clusters of companies. For example, Veolia connects a wide variety of SMEs and larger companies alike in the central cluster through its participation in various projects. Around the main cluster, we see various other groups of companies – the cluster at the top right includes Hewlett Packard and Procter & Gamble.
The FP7 funds are reserved to projects where multiple organizations collaborate. The result of this policy is clear. With graph analysis, we have seen that the European Union was successful in creating a large networks. National research institutions and large companies collaborate between each other on R&D on a large scale. Exploring the data, we can see key actors, research clusters and emerging trends.
A spotlight on graph technology directly in your inbox.