Visualizing the graph of French companies with Neo4j
Recently Infogreffe, the organization responsible for keeping track of company information in France, opened access to its data. Anyone can now view key information regarding French companies created in 2014 and 2015. Let’s explore this data with a graph-approach to understand the connections between French companies.
Open data about the French companies
For years Infogreffe has enjoyed a lucrative monopoly on the diffusion of legal information about French companies. That monopoly will cease in the near future to foster innovation. As a result, Infogreffe is starting to adopt an open data approach. It is now possible to have access to a registry of recently created or terminated companies.
The data is conveniently available as a CSV file. The Infogreffe data set for 2015 includes 13 columns and 108,175 lines. The tabular approach of a CSV file or spreadsheet makes analyzing the relationships in the data more difficult though. To circumvent that issue, we must think of the entities and relationships hidden in the tabular structure.
This process is accomplished by designing a network or graph model for our data:
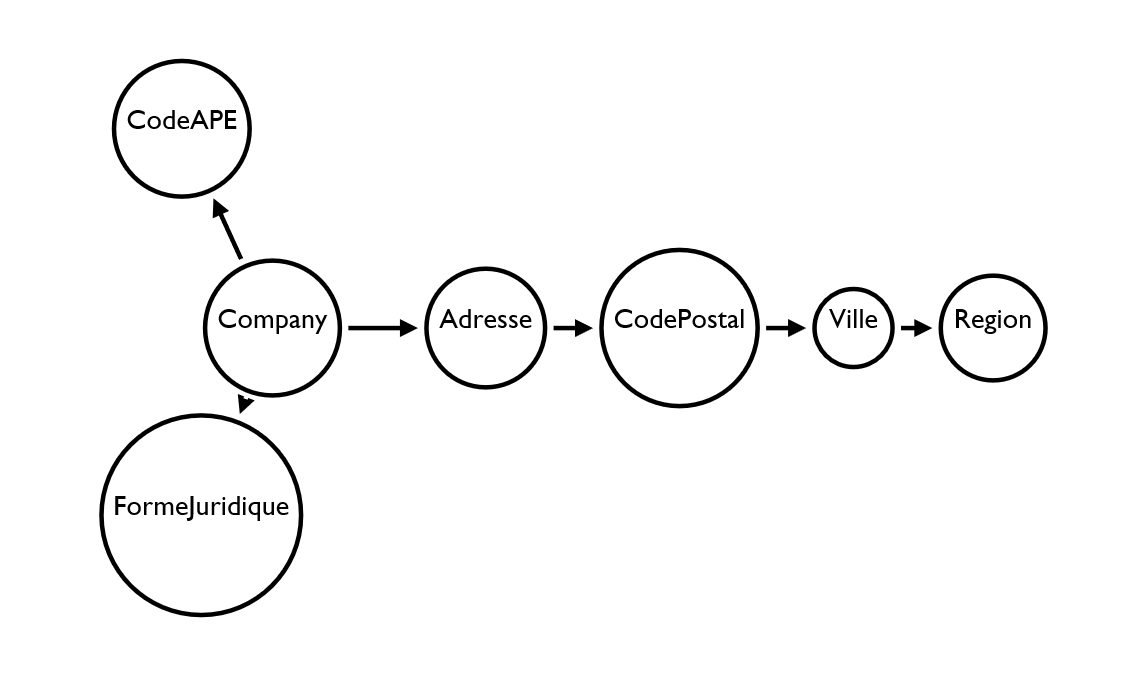
Now that we know how we want to structure our data, we need to turn our CSV files into a graph. To do that we will use the import functionalities of the Neo4j graph database.
Here is a script that takes the CSV file of the Infogreffe data and import it into a Neo4j graph database:
In a few minutes, we have a Neo4j database with the graph of recently created French companies.
Visualizing the data with Linkurious
Now that the data is stored in Neo4j, we can explore it with Linkurious easily.
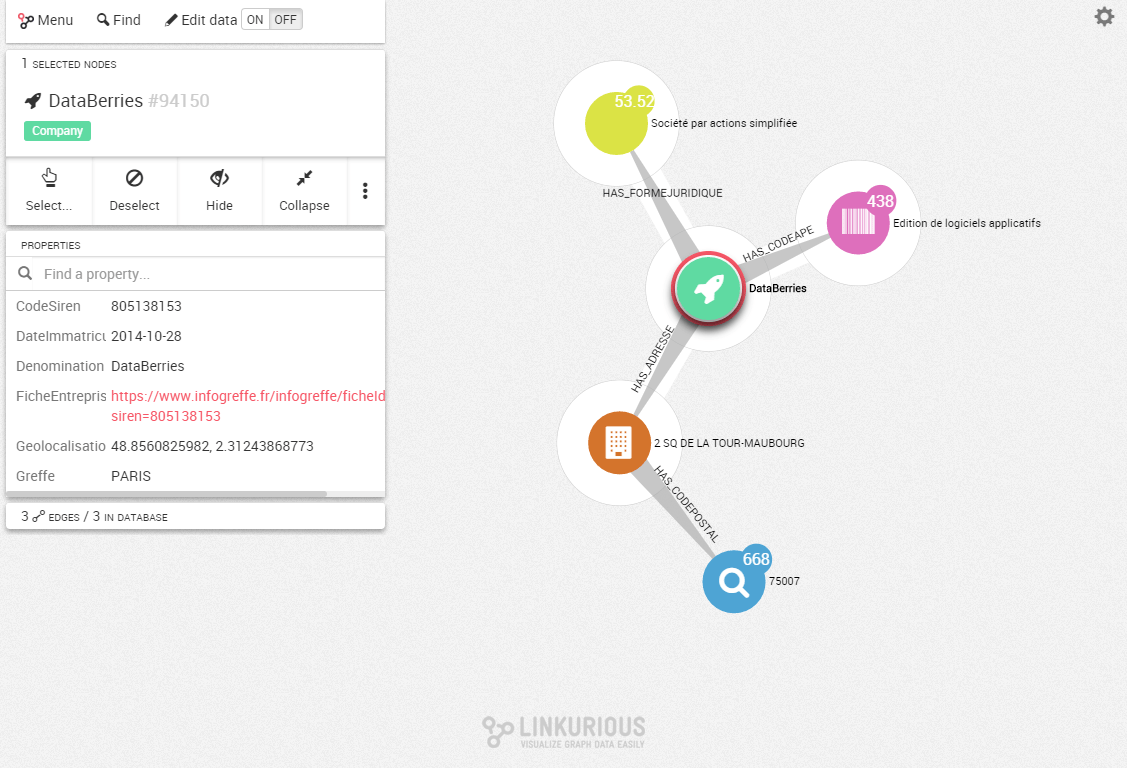
For example, we can look up a company called “Databerries“. We can view that it’s connected to an APE code, an address and a “forme juridique” (legal entity type). Through its address, Databerries is connected to 53,521 neighbors. Through its APE code, Databerries is connected to 438 similar companies.
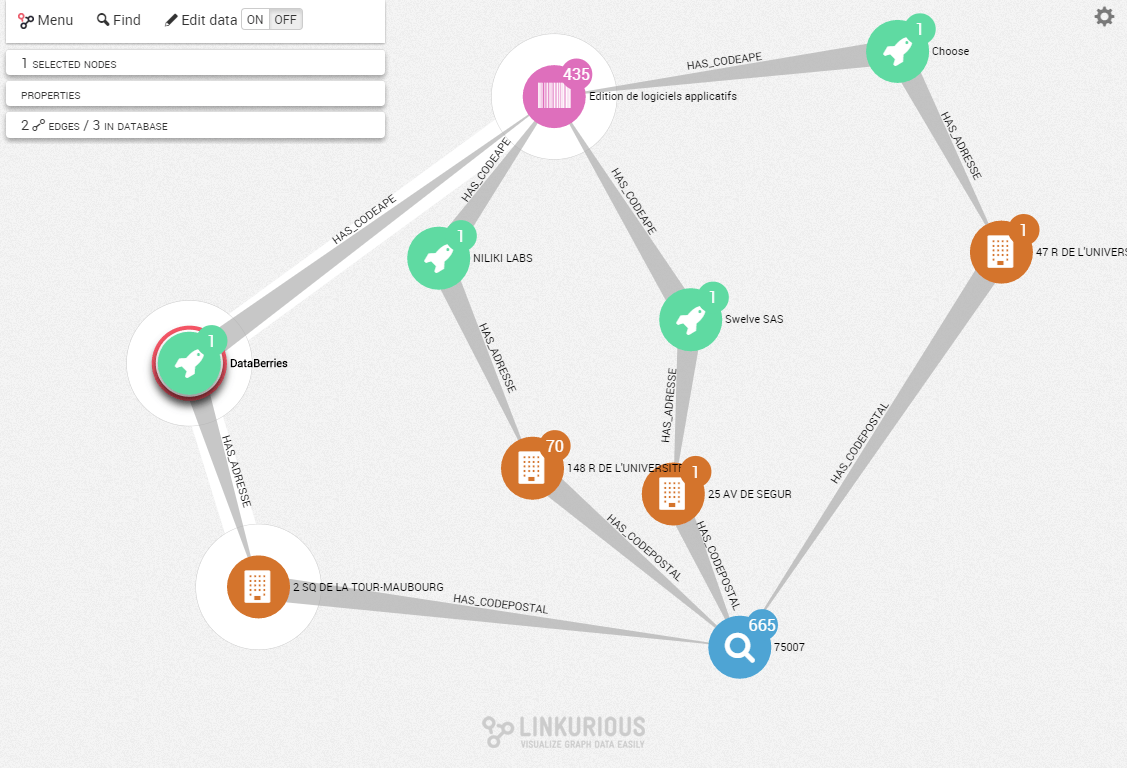
Visually I can explore the graph to find the other companies that are in the “Edition de logiciels applicatifs” sector and have a “75007” postal code like Databerries.
Linkurious is compatible with Cypher, the graph query language of Neo4j (which will be soon supported by Oracle and Spark). We can use it to go beyond simple search and find advanced patterns in our data.
Let’s say for example that we find to find the postal code in which there is the highest concentration of a particular type of software companies (“Edition de logiciels applicatifs” in French).
Here’s a Cypher query that can help us:
// Where are the recent companies concentrated in?
MATCH (a:CodeAPE {name: ‘Edition de logiciels applicatifs’})<-[:HAS_CODEAPE]-(b:Company)-[*]->(c:CodePostal)
WITH count(b) as score, c
RETURN c.name, score
ORDER BY score DESC
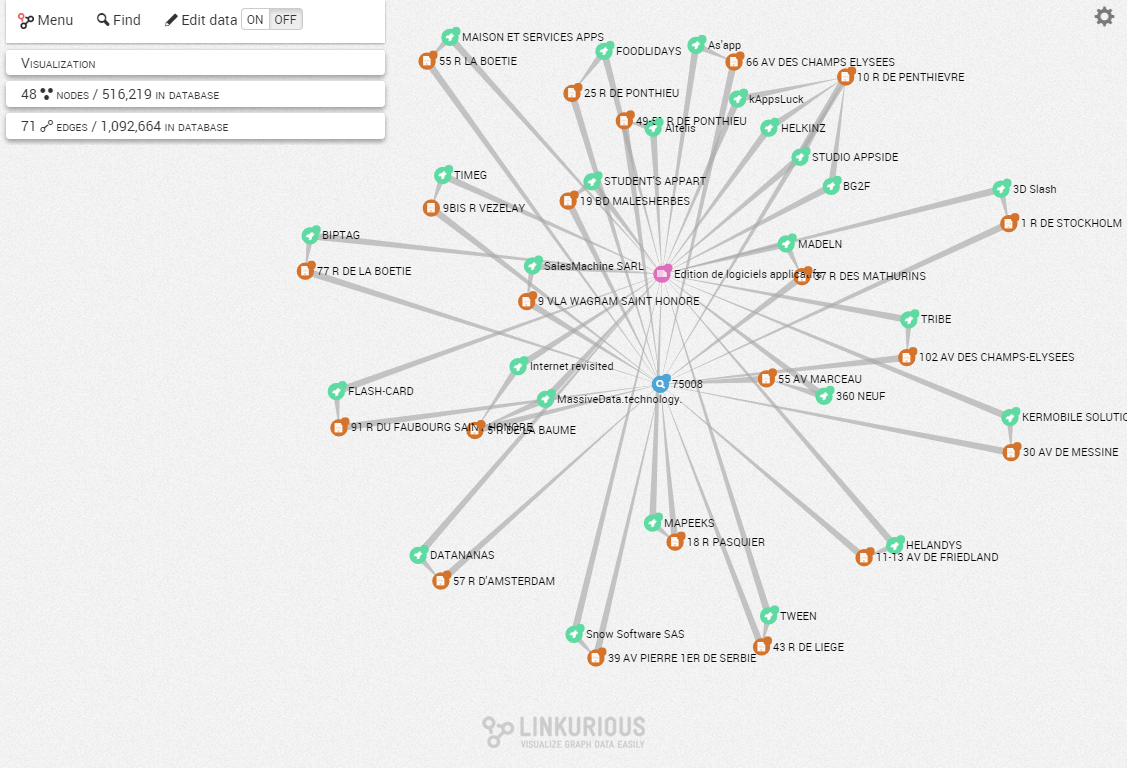
LIMIT 5The highest concentration of recently created software companies is in the 75008 district in Paris with 25 results. I can display the result via Linkurious to visualize the software companies in the 75008 district:
This article show how it’s possible to use a graph approach to explore the Infogreffe data about French companies. Perhaps in a few months we will have access to data about the boards of directors, and we will be able to add an extra layer of connections.
With a little preparation, it is possible to use a graph approach to understand the connections in your data.
A spotlight on graph technology directly in your inbox.