Visualize your RedisGraph data with Ogma
Ogma is a JavaScript library for large-scale graph visualization and analysis. It integrates directly with RedisGraph database to help RedisGraph customers build applications to visualize their graph data.
Redis and RedisGraph technology
In July 2018, RedisLabs announced the release of their graph module, RedisGraph:
 “RedisGraph is a graph database architecture implemented as a Redis module, using GraphBLAS sparse matrices for internal data representation and linear algebra for query execution. It is implemented purely in C, and has been tested on Linux and OS X distros. We are using Cypher as our query language, and look forward to working toward GQL with the graph database community!”
The RedisGraph database builds upon Redis’ backend, leveraging the power of the Cypher language. That means that any application can leverage both the power of the Redis storage and an intuitive query language designed for graph.
Because of the modular architecture of Redis, it is possible to integrate the RedisGraph module with an additional module, the RedisSearch one, which provides a full-text-search experience right into the graph database.
Recently the 2.0 version of RedisGraph has been released and it brings even more support for a better full-text-search experience and an even better Cypher language support.
Connect Ogma to the RedisGraph database
The Ogma library is agnostic to the data source: simply give it nodes and edges as input, and it will render it as a graph. The RedisGraph team provided a set of drivers to make it easy to integrate the tool inside many backend applications. We created a simple NodeJS web server that uses the RedisGraph.js driver in order to expose a HTTP client.
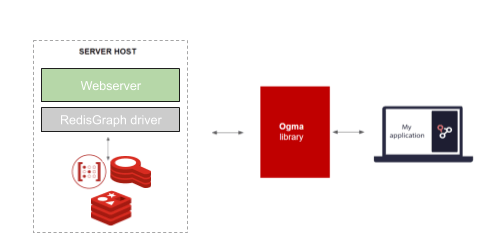
On the client side, the Ogma application will send Cypher query strings that are forwarded to the RedisGraph driver and, once the result is ready, the response will be pushed to the client to visualize: the Ogma application will then translate the JSON into the Ogma Graph format and visualize them.
Visualize RedisGraph to find hidden insights in your data
The analysis of graph data is a decisive asset in many fields such as cyber-security, intelligence analysis or financial crimes investigation. The graph approach is the best way to understand how data is connected and take advantage of it. With Ogma you can find insights in large-scale graphs and discover non-obvious relationships between entities. You can detect suspicious patterns in a glimpse thanks to the holistic representation of your data.
Once the Ogma library is connected to the RedisGraph database, you can query it to visualize your graph data. In the example below, we connected Ogma to an instance of RedisGraph.
We used the Paradise Papers dataset – from the ICIJ Offshore Leaks database – to create the Ogma Web application.
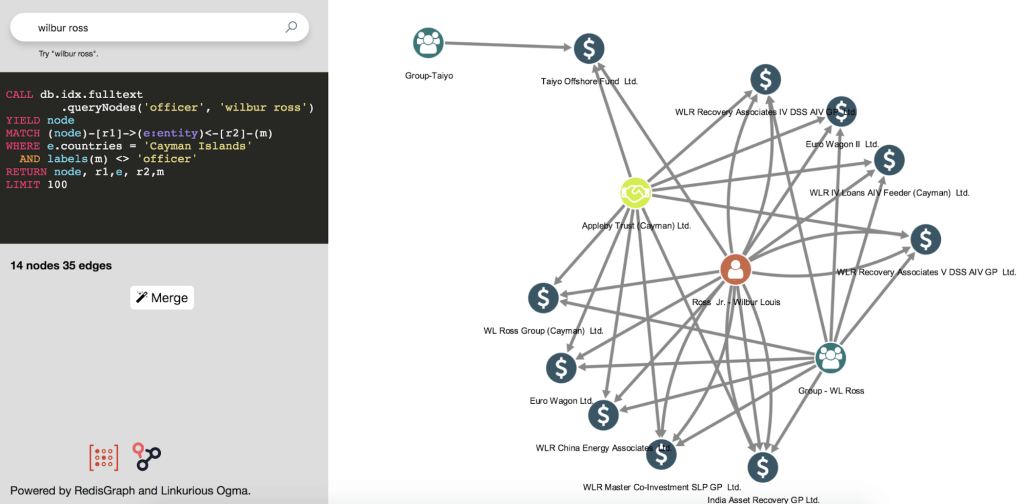
We visualize in a glimpse the connections within the data using the power of the full-text-search capability available in RedisGraph. After a few clicks to dynamically retrieve additional connections, we can immediately notice a suspicious connection at the center of the visualization. This pattern may indicate an interesting fact that can be investigated further by analysts.
Ogma makes it possible to leverage the power of RedisGraph with this simple integration. It’s also possible with our graph visualization library to facilitate interactions: switching to another graph layout (circular, geospatial, force-directed, hierarchical, sequential and more), filtering nodes and edges, grouping nodes and edges, etc. Ogma enables RedisGraph customers to visualize their data, helping non-technical users find hidden insights in real-time within the data.
The code of the current visualization is available in this Github repository.
The RedisInsight technology
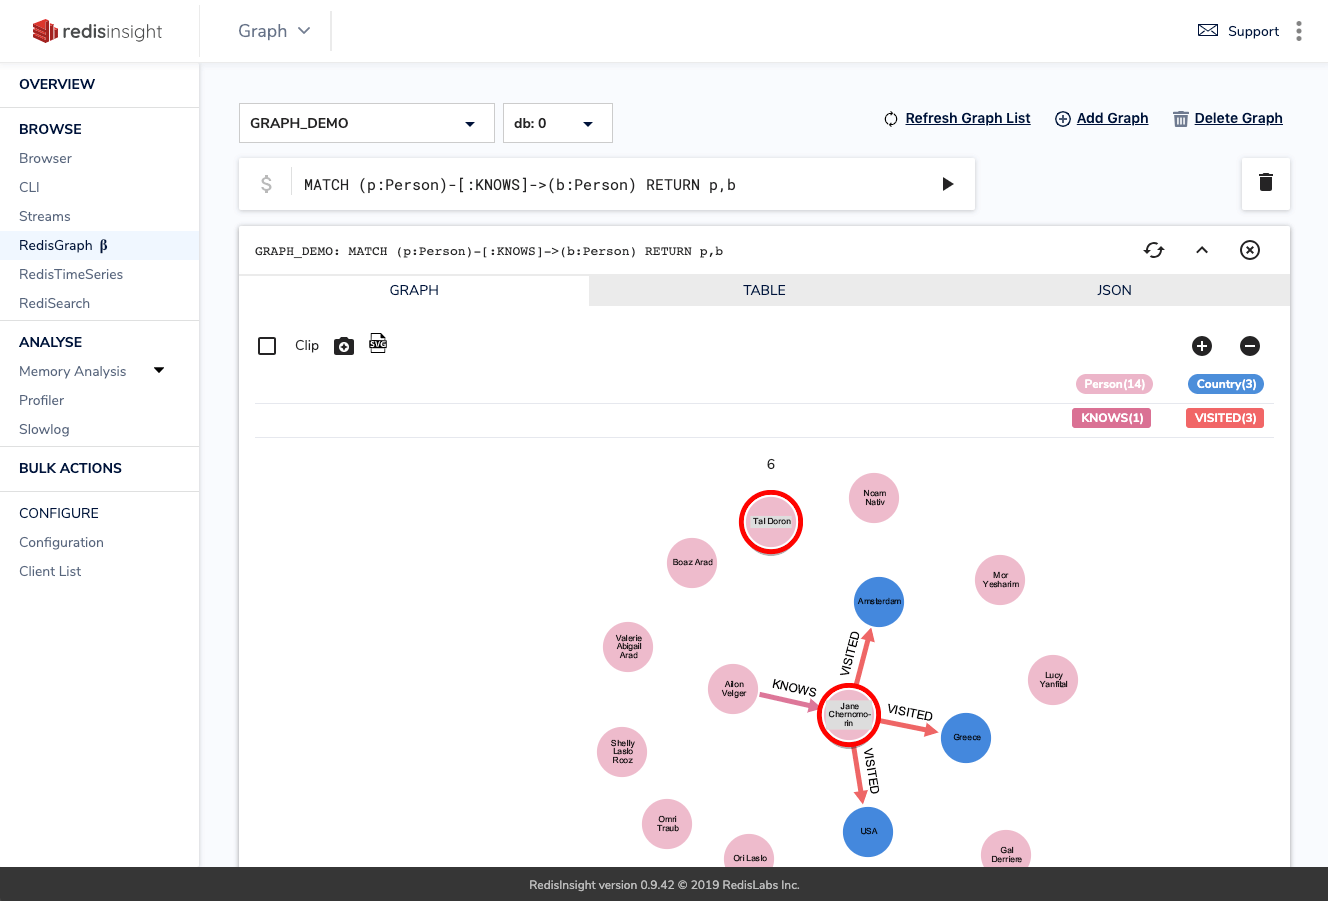
RedisLabs provides a free tool called RedisInsight as a multi-management GUI for Redis, which includes a management section for the RedisGraph module as well.
The tool lets the DB administrator execute Cypher queries in order to check results and evaluate their performances, together with a powerful yet basic visualization of the graph data.
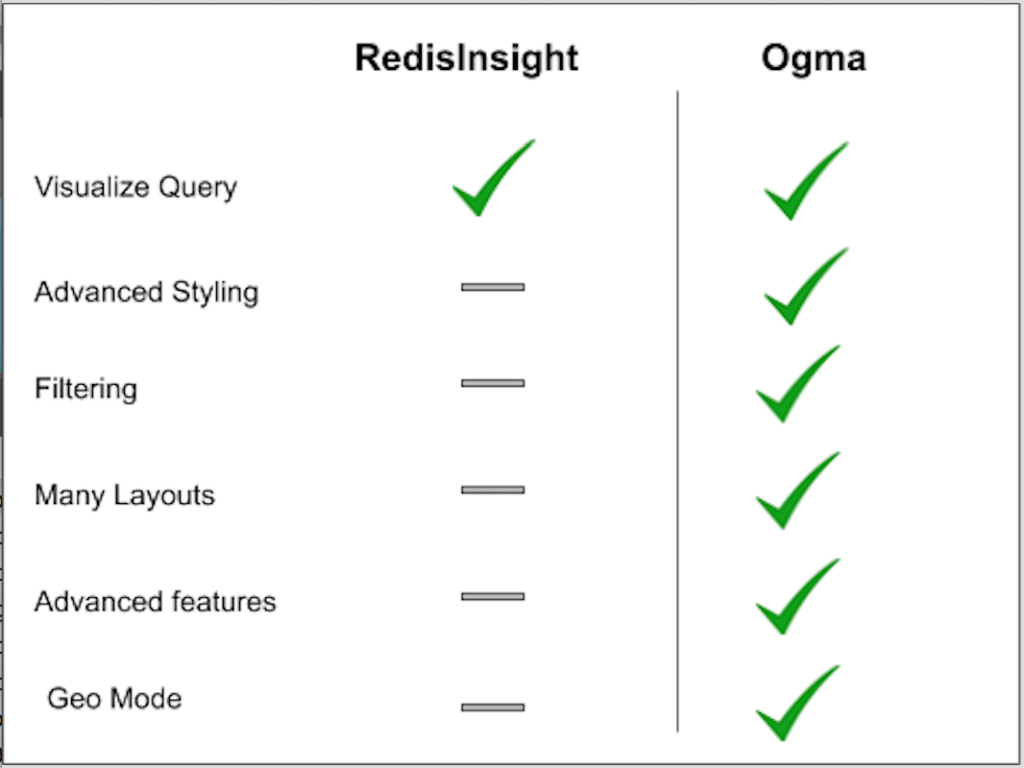
RedisLabs has partnered with Linkurious to include the Ogma library in RedisInsight. This enables you to interactively explore data within RedisGraph.
For more integration into your app, it is recommended to use a licensed version of Ogma to build your own.
RedisGraph users can now use Ogma to visualize their graph data. If you want to know more or try Ogma, contact us today.
A spotlight on graph technology directly in your inbox.