Visualize your knowledge graph with Stardog and Linkurious Enterprise
Updated 15 March 2023: Linkurious Enterprise no longer supports Stardog, but we still have plenty of options for knowledge graph visualization. You can visualize your knowledge graph in Linkurious Enterprise using a different backend. Learn more on our documentation site.
You can also use Stardog with Ogma, our all-in-one JavaScript library for large-scale interactive graph visualizations.
What is a knowledge graph?
Popularized by the introduction of Google’s Knowledge Graph in 2012, the use of knowledge graphs is now spreading among businesses.
Defined as large networks of entities that integrate semantic types, properties, and relationships between entities, they organize all the data in an enterprise-wide graph within an organization. Enterprise knowledge graphs serve as centralized sources of integrated knowledge.
They came as an answer to the dispersal of enterprise knowledge across multiple data silos and data duplication inside expensive data warehouses. Contrary to relational systems, they are flexible enough to embed contextual and semantic information about the data and let you adjust their model as new data items are injected into the data pool.
The knowledge graph technology stack
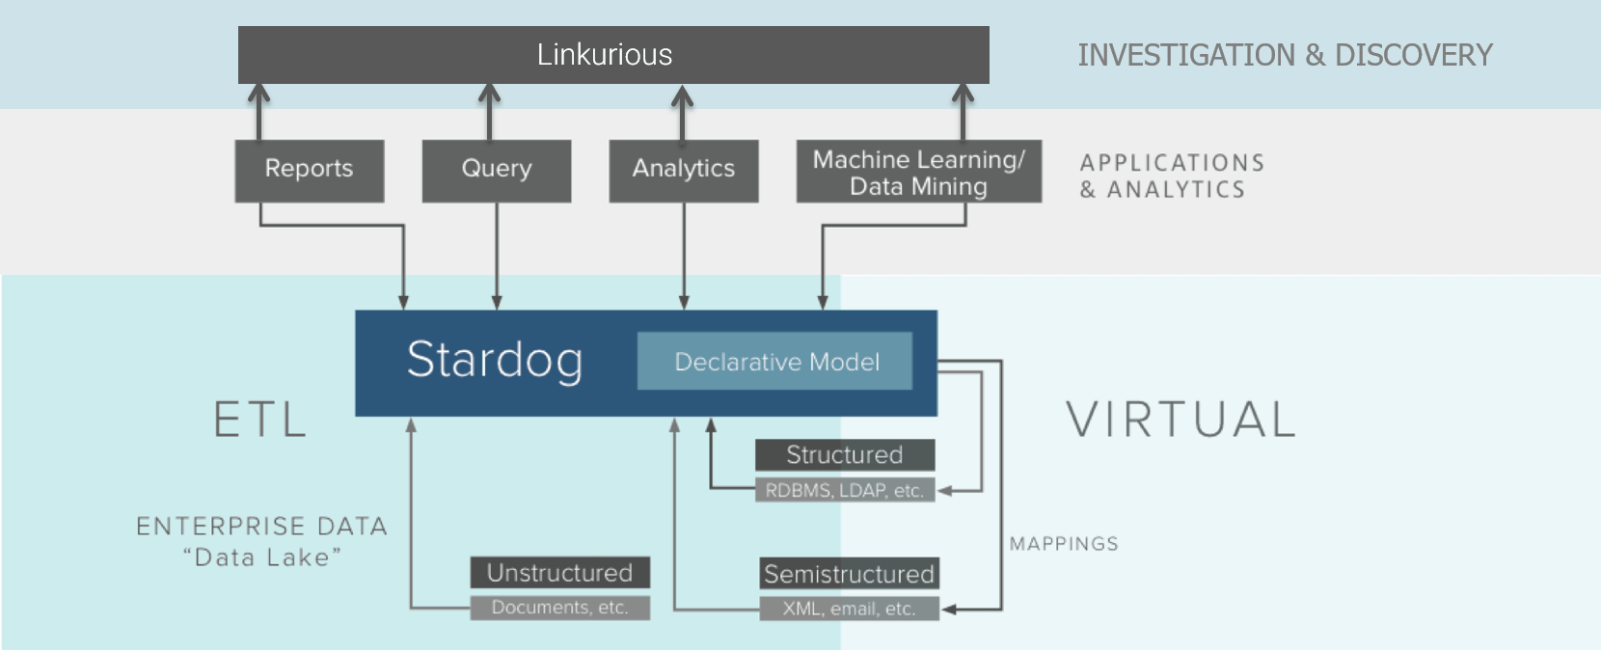
Several companies now propose their services to help organizations unify their data and avoid dangerous blind spots or time-consuming projects. Among them, our partner Stardog has developed a powerful combination of a graph database and a world-class knowledge toolkit, providing features to operationalize and create knowledge.
Stardog helps organizations query massive, disparate data and transform them into actionable insights. Its technology combination lets Stardog support a wider and deeper range of services than any other graph or data unification platforms.
On top of the Stardog platform, Linkurious Enterprise makes knowledge graph data available to analysts through a code-free graph visualization and analysis platform that can be deployed on-premise or in the cloud. Linkurious Enterprise can be plugged directly to Stardog, letting users explore, query and visualize their enterprise knowledge graph data.
We’ve talked previously about the benefits that graph visualization offers, but to sum up, analysts will spend less time assimilating information. They also have a higher chance to discover insights by reducing blind spots occurring within tabular systems. It provides context and lets them achieve a better understanding of a problem.
Connecting Stardog to Linkurious Enterprise
If you don’t have a Stardog instance available yet, you can download a 30-days trial of Stardog Enterprise or the Community Edition from the Stardog website. The installation process is straightforward, and an extensive documentation is available to help you.
Deploy Linkurious Enterprise on-premise or in the cloud and connect it to your Stardog instance by providing its address and credentials.
At this point, your data is stored in Stardog but is searchable, editable and viewable as a graph in Linkurious Enterprise. This complementary combination of Stardog and Linkurious Enterprise helps you address all the stages of a knowledge graph project, from building, enriching and analyzing your knowledge graphs to making it available to your end-users.
Visualizing your Stardog knowledge graph to find hidden insights
The data depicted in the example below is from a Stardog dataset, available in stardog-examples github repo. The data model brings together the following entities: people, companies, addresses, shareholding and bank transaction, connected together by five types of relationships. For financial crime analysts, it’s a great opportunity to detect suspicious behaviors and unveil fraudulent networks by bringing together heterogeneous data elements.
To fasten and simplify investigation, you can readily access and edit your data from Linkurious Enterprise. You can intuitively explore entities of interest and their connections by interacting with nodes and edges in the visualization interface.
Find insights in your knowledge graph
The complementary combination of Stardog and Linkurious Enterprise allows you to, first, build a holistic picture of your data and reveal hidden connections across silos and, secondly, leverage the knowledge graphs on a day to day basis. Our two products integrate seamlessly to make your life easier. So if you are struggling to take advantage of complex connected data, get in touch today and see for yourself!
A spotlight on graph technology directly in your inbox.