Using Linkurious.js and Neo4j to visualize the Czech health industry
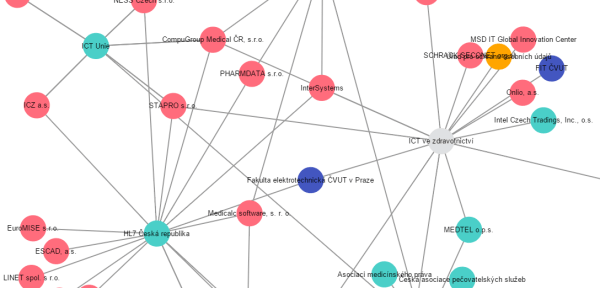
We recently connected with a team from the University of Economics, Prague who used linkurious.js to build an interactive map of the Czech healthcare ecosystem.
The Czech Health industry
In the Czech Republic like in many other countries, there’s a lot of interest in eHealth, the practice of using information technologies to improve healthcare. We recently met with a team from the University of Economics, Prague (VŠE) who has been developing an innovative methodology for eHealth projects. The team of students, headed by Martin Potančok (Ph.D. Student & Program Manager at the VŠE’s Business Accelerator) and Jiří Voříšek (Professor at the VŠE), relies on graph visualization to help healthcare organizations identify potential partners.

Šimon Machač, Dagmar Vondrová and Stanislav Vávra first collected data about eHealth projects and conferences to identify connections between healthcare organizations, vendors and influencers. The result is a graph that helps understand which actors are leading the eHealth transformation in the Czech Republic.
To turn this data into something that could influence whom healthcare organizations could partner with or which event they should attend, they needed to provide a direct access to the data.
Looking for an easy way to visualize graph data
To turn their data into something useful, Potančok’s team decided to use graph visualization. “For us it was the most intuitive way to display the network of actors in the eHealth ecosystem” explains Potančok. The VŠE’s team used the Neo4j graph database to store its data. It comes with a visualization interface but it was too technical to be used as a front-end on a public website. They evaluated a few JavaScript graph visualization libraries but were frustrated. “With Alchemy.js for example, the connection to Neo4j was too complicated and the ability to elegantly display the data, to view tooltips or to filter which we all needed were simply not there” says Potančok. When they discovered linkurious.js, the choice was fairly quick. Courtesy of Benoît Simard from Neo Technology, there’s a plugin to connect linkurious.js to Neo4j very easily.
// Instantiate sigma:
var sigmaInstance = new sigma({
graph: g,
container: ‘graph-container’
});
// Run Cypher query:
sigma.parsers.cypher(
{ url: ‘http://localhost:7474′, user:’neo4j’, password:’admin’ },
‘MATCH (n) OPTIONAL MATCH (n)-[r]->(m) RETURN n,r,m LIMIT 100’,
sigmaInstance,
function() {
sigmaInstance.refresh();
}
);
Potančok and his team also found concrete examples to add the abilities to drag nodes, to view tooltips or to filter their graph visualization. “Most importantly, linkurious has an active community and we got great answers to our issues through Github” adds Vávra.
A few days to build a build a beautiful map
Machač who has a good knowledge of JavaScript had never worked on a graph visualization project. “I started with reading wiki articles and some examples, which gave me sufficient amount of information to start making my own graph visualization. Then, I started typing my first lines of code. To speed things up, I drew inspiration from the available examples linkurious.js offers. In just a few days, I had something great” says Machač.
The result can be seen here: link (in Czech)
The code for the project is available here: link
You can download linkurious.js on Github here.
Linkurious.js speeds up the development of modern Web applications that leverage the power of graph visualization and interaction. Use it to explore the connections in your data!
A spotlight on graph technology directly in your inbox.