French university drives change and manages it infrastructure with linkurious
The Université de Lorraine![]() is a French public university created in 2012 by the merger of 4 regional universities: Henri Poincaré, Nancy 2, Paul Verlaine and the Institut National Polytechnique de Lorraine. It offers 101 accredited research centers organized in 9 research areas and 8 doctoral colleges to 55,000 students.
is a French public university created in 2012 by the merger of 4 regional universities: Henri Poincaré, Nancy 2, Paul Verlaine and the Institut National Polytechnique de Lorraine. It offers 101 accredited research centers organized in 9 research areas and 8 doctoral colleges to 55,000 students.
Within the administration, the Department of Studies and Information System Development (SISD) is responsible for designing, developing and optimizing the university information system (IS).
Its role is critical to maintain the responsiveness of the services and ensure the proper functioning of the institution. The team manages the existing resources, oversees the integration of software or applications into the IS and supports the development of bespoke applications for education departments.
The challenges of renewing a complex IT infrastructure
During the merger, the SISD team had to oversee the integration of four existing IS into one, creating a rich and complex environment. This was followed by the requirement of updating some software components, adding an extra layer of risk and complexity for the team in charge of maintaining application and service availabilities.
This modernization project called for an impact analysis on the overall infrastructure to identify which components would be impacted by the changes and prevent downtimes. The integration of new technology also required interoperability planning to avoid additional operational costs.
The team initially used an architecture management software to build reference views, describe and manage the IT infrastructure. But the lack of dynamic infrastructure visualizations or automatic synchronization with their database and Document Management System complexified and slowed down the process.
Without the right tool to visualize the overall IT landscape and its interconnections, it was nearly impossible to understand dependencies on the micro level. Analysing the infrastructure and getting answers was a long and tedious process for the team. In addition, the lack of synchronization generated extra work, duplicated and sometimes outdated resources.
The solution: modeling and visualizing IT assets with Linkurious Enterprise
To simplify and accelerate the process, the team decided to leverage the potential of graph technology. First, they synchronized their Content Management System, which stored the data about their IT infrastructure, with a graph database. The design of a graph data model, compiling together applications, servers, domain components and their respective dependencies, was simple as the underlying infrastructure was inherently a graph.
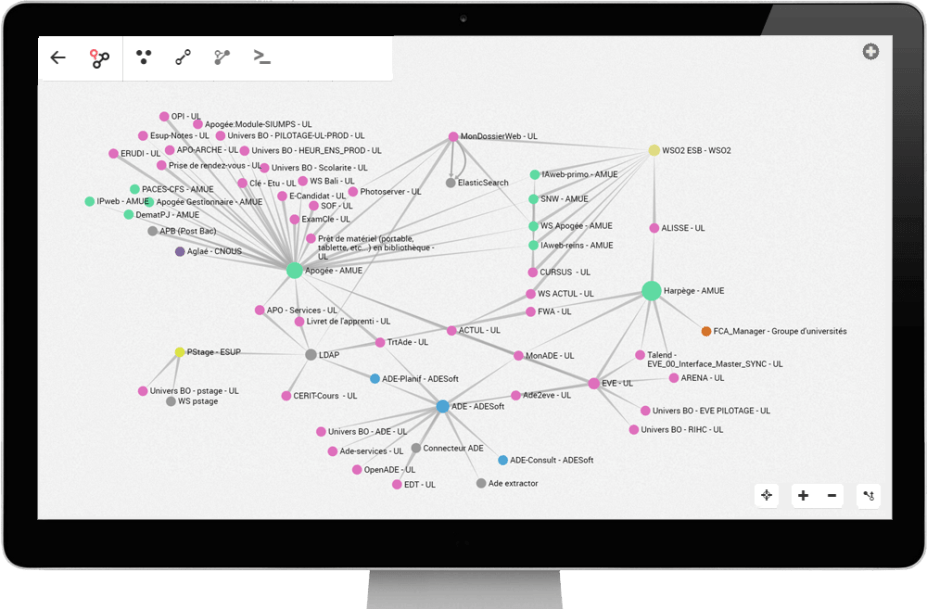
“In the context of an IS counting more than 200 applications and 150 servers, linked in a complex and constantly changing way, it was essential to work with a graph tool” said Lionel Grosjean, project leader.
They loaded the data into a Neo4j graph database and it was instantly available in Linkurious Enterprise. From here, the team was able to understand in a glimpse the complex interactions between IT assets, which is essential in infrastructure change projects.
With the dynamic graph visualization interface, Lionel and his team could easily navigate through their IT infrastructure, expending neighboring components. This helped to answer questions on macro and micro levels such as “how are my servers connected? what are the single points of failures in my infrastructure? What impact will the replacement of this component have on my system?
Quickly getting valuable insights from dynamic visualization
With Linkurious Enterprise, the SISD team was able to model and understand the logical and physical connections within their infrastructure. The data was synchronized in real time with their Document Management System, reducing the data entry and processing time.
The team gained visibility on the system dependencies with Linkurious Enterprise. The ability to use full-text search allowed them to explore their infrastructure on micro levels to visualize specific parts of the domain. They had the possibility to ask better questions, get answers and accelerate the decision process.
The SISD department was able to collaborate efficiently, improving the quality of the data and the visualizations with a single source of truth collaboratively maintained. They were able to interactively communicate their analysis results to non-technical stakeholders thanks to embeddable visualizations.
As a result, they successfully carried out the first steps of their IT modernization project. “Linkurious enabled us to easily map our IS to prepare its evolution and to evaluate the impacts” declared Lionel Grosjean. “With this new visibility, we can foresee infrastructure changes faster and with fewer risks.”
A spotlight on graph technology directly in your inbox.