The Crunchbase Graph : data modelling
Crunchbase is one of the most complete database for the startup ecosystem. Startups, investors, markets, funding rounds : Crunchbase tracks how all of these are connected. In a series of blog posts we are going to analyse the Crunchbase Graph. Let’s start with the first step : modelling the data.
The graph of the startup world
Crunchbase is a public database for the startup ecosystem. It tracks companies, investors, funding rounds, people and events and has more than 500,000 data points. The data is provided by Crunchbase’s 50,000 active contributors. It is reviewed and updated by a small team of moderators. CrunchBase claims it has 2 million users accessing its database each month.
Recently, Crunchbase announced that to handle its data it would use the Neo4j graph database. That choice is part of a larger vision : the Business Graph.
« Companies are formed, funded, and tested in the marketplace. Products get designed, built and launched. And entrepreneurs, investors and a big cast of business people drive everything forward. Now imagine if you could not only see a timeline of all that activity, but you could also uncover the connections between everyone and everything. That would be the Business Graph. »
Crunchbase has an API and odes a monthly export of its data.
From tables to graph : data modelling
First the bad news : the data Crunchbase makes available is in a spreadsheet. Not the best way to understand what a given company or investor is connect to. Thankfully, it is possible to turn any spreadsheet into a graph. In order to do that, we will use the CSV import functionality of Neo4j.

Before coding anything though, it is necessary to start with one question : how do we want to model our data aka where are my nodes and edges? Our objective is to decide how we are going to use the data present in the spreadsheet to build a graph.
In the Crunchbase spreadsheet we can find the following sheets : “Licence”, “Analysis”, “Acquisitions”, “Rounds”, “Companies”, “Additions” and “Investments”. For the purpose of our article we are going to focus on the startups and the investors who fund them. The data we need is in the sheets “Companies”, “Acquisitions” and “Investments”.
Here is what the “Companies” sheet look like :
Let’s start with the key nodes in our model. We are interested in the startup, the investors and the funding rounds. We are going to use the columns of the spreadsheet to create them. We will create nodes in Neo4j and give them properties stored in the following columns :
- the startups : permalink, name, homepage_url, funding_total_usd, funding_rounds, founded_at, founded_month, founded_quarter, founded_year, first_funding_at, last_funding_at (data in the “Companies” sheet) ;
- the investors : investor_permalink, investor_name, funding_round_permalink (data in the “Investments” sheet) ;
- the funding rounds : funding_round_code, funded_at, funded_month, funded_quarter, funded_year, raised_amount_usd (data in the “Investments” sheet) ;
Let’s take an example. In the “Companies” sheet above we are going to focus on the 2nd row. From that row we want to extract a node that will have the following properties :
In the graph we will create, there will be a node that will represent a startup called “Waywire”. It will have a series of properties including one called “name” which will have the value “#waywire”.
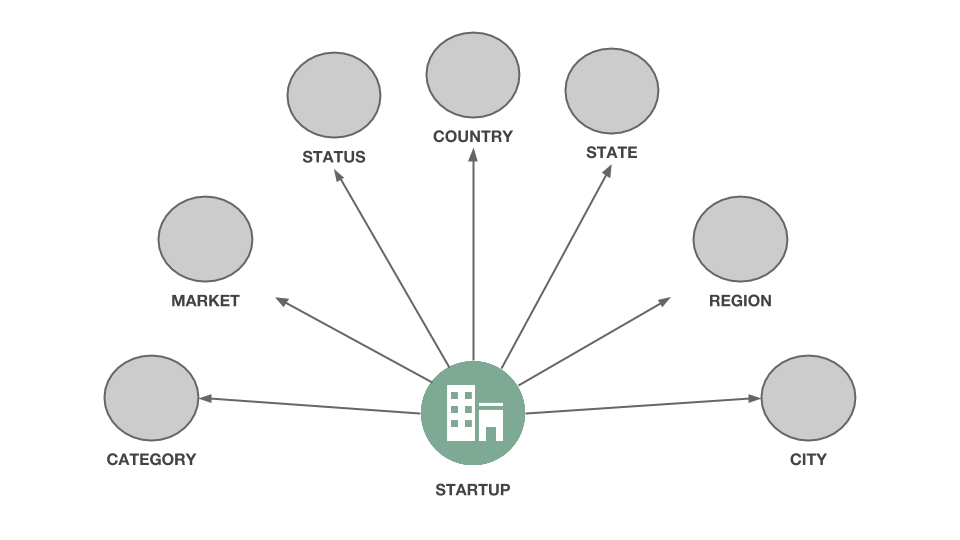
You may have noticed that I have chosen not to attach to my “startup” node every values that were in the “Companies” sheet. Why? Some values like “market” will be modeled as nodes connected to the startup “node”. For example, “Waywire” will be a node connected by an edge to the node “News”. Later on, this will make it easier to see how different startups are connected via the market they address.
When modelling a graph, it is important to keep in mind the questions we will be asking later.
Here is a picture of the graph we will extract from the “Companies” sheet :

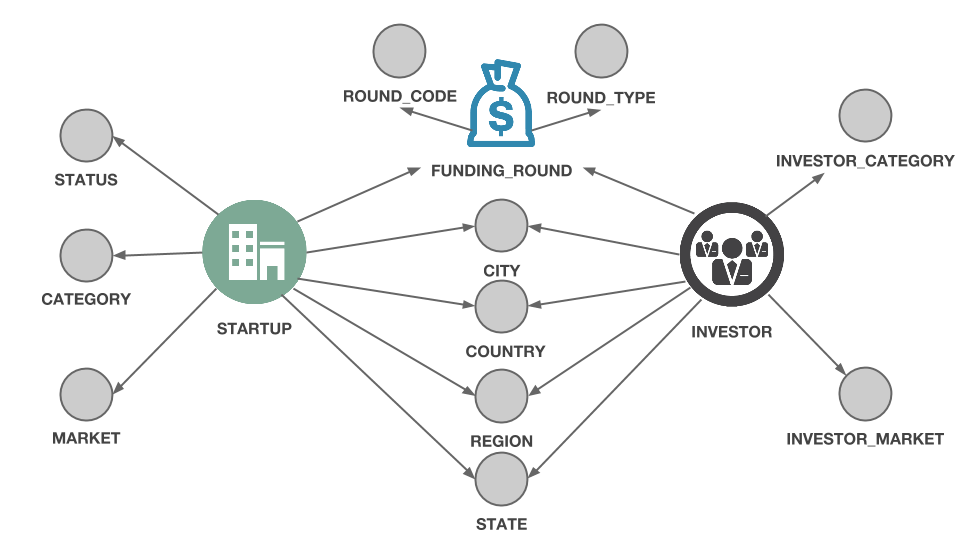
The “Investments” sheet allows us to complete our graph by connecting a few new objects. Putting it all together, with is how our complete graph data model will look like :

From a couple of sheets, we have extracted a graph data model where there are 14 different kinds of entities.
We haven’t written a single line of code yet. What we have done is think about the data we have and how we want to transform it in a graph. That process has allowed us to see a few connections that were within the original data but hard to view in a spreadsheet. The startups are connected to each other by the market they address. Investors can be connected to certain type of funding rounds. Of course, an investor and a startup can be connected via a funding round.
A spotlight on graph technology directly in your inbox.