How to visualize your Facebook network
Facebook knows the social network of more than a billion persons. If you are a Facebook user though, you have little tools to explore your own social network. We are going to see how, with a few scraping tools, a Neo4j graph database and Linkurious, we can visualize our Facebook network.
There is no easy solution to visualize your Facebook network. Facebook is restricting access to its API. As a result, Netvizz, an application to visualize one’s Facebook network, was recently discontinued. Visualizing your Facebook network has become hard.
Hervé Piedcoq, data analyst and OSINT expert is going to show you a method to 1) collect, 2) store and 3) visualize your Facebook network.
Collecting the data to build your Facebook network
1st step : download your friends’ list
We will use OutWit Hub, a powerful yet easy to use scraper, based on Mozilla and XUL. It has built-in functionalities such as table and list detection, an extractor engine based on the source code of a web page, macros and job tools.
We could, of course, use Python or other languages to scrape Facebook, but OutWit Hub is clearly non-programmer oriented and immediately operational.
Connect to your account via OutWit Hub and display the complete list of your friends.
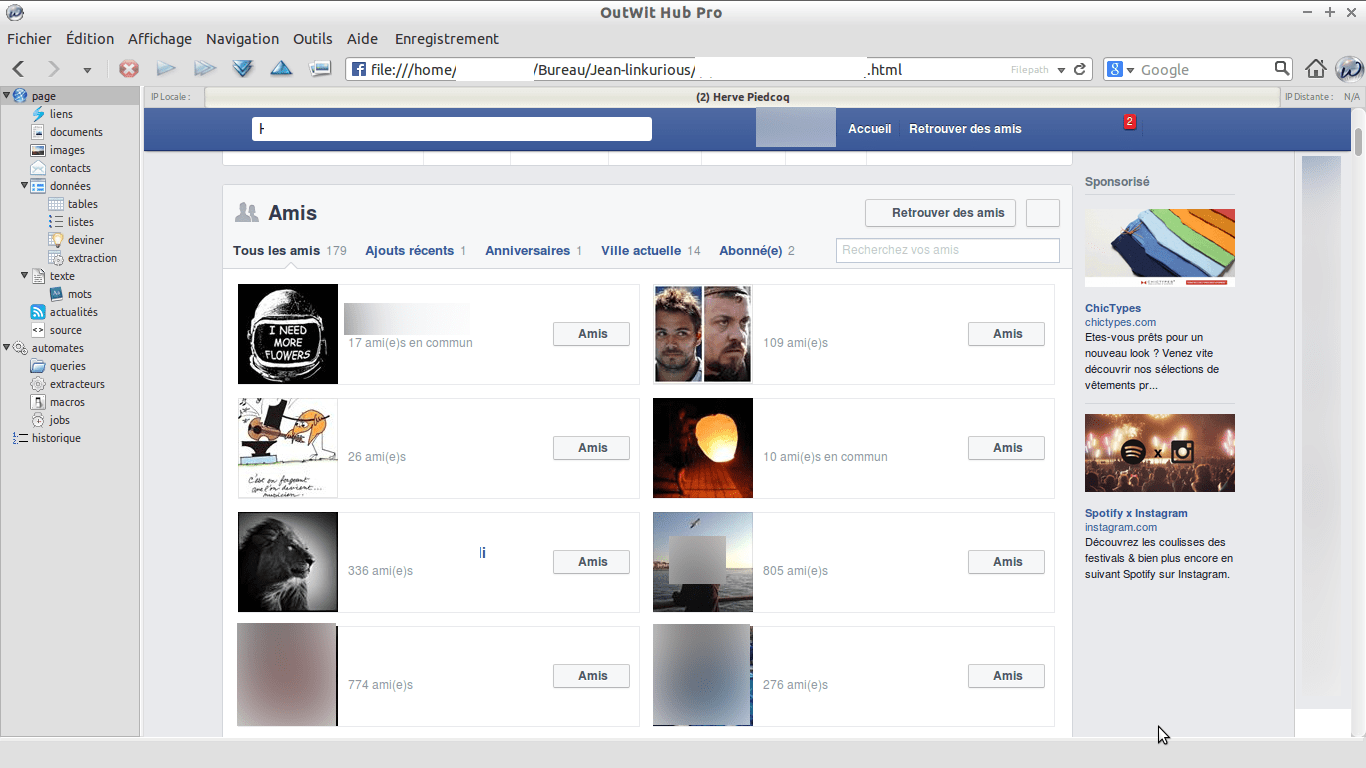
OutWit Hub uses the source code of the webpage to scrape the data. The problem is that Facebook uses a lot of Javascript that pollutes the code and really makes it hard to analyze.
A good way to avoid this issue, is to save this webpage in HTML on your hard disk and open it as a static page in OutWit Hub.
On the left panel, click on “links” (“Liens” in french), to grab all the links present on this page.
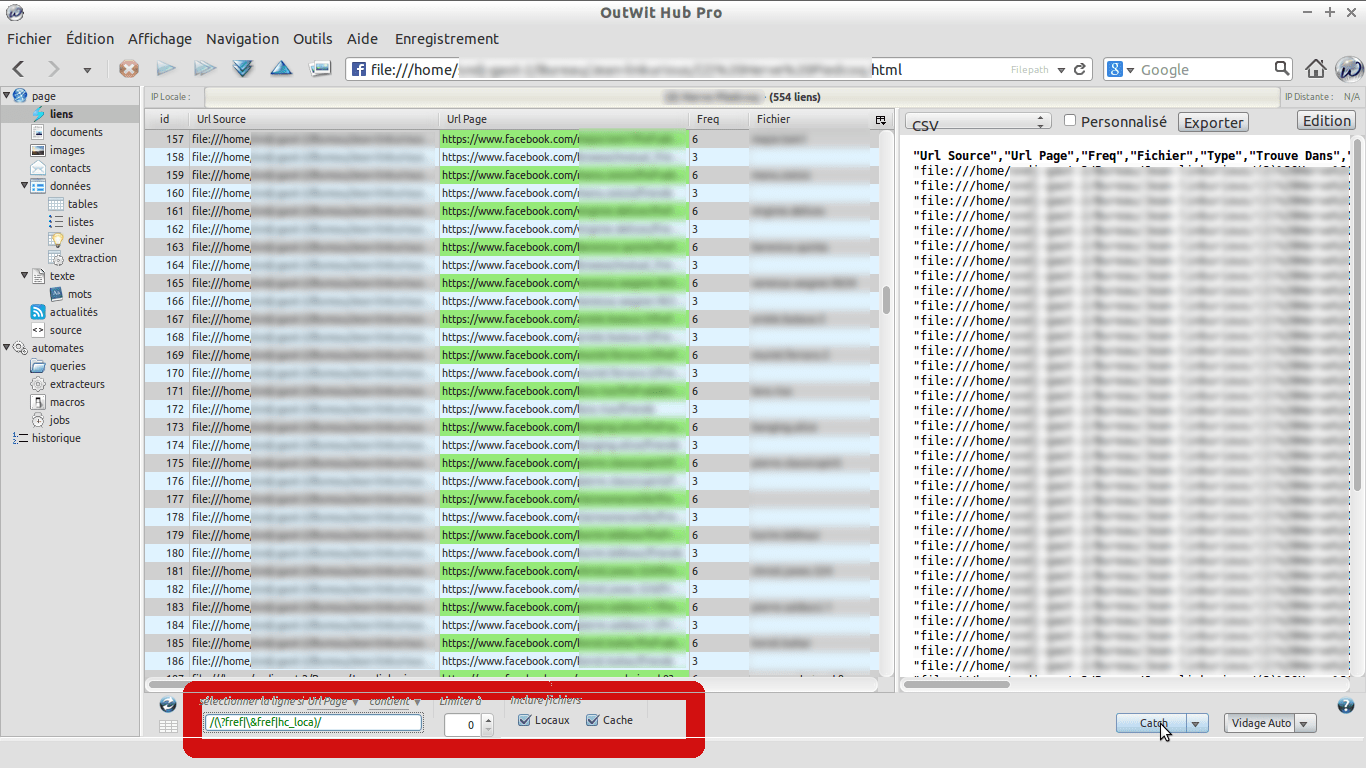
Filter these links using this regex in the bottom left corner box :
/(\?href|&href|hc_loca)/
Now export the selection to a csv file.
Simply replace the values in the column Url Source, with your profile ID, and rename it “Source”. Rename Url Page as “Target”.
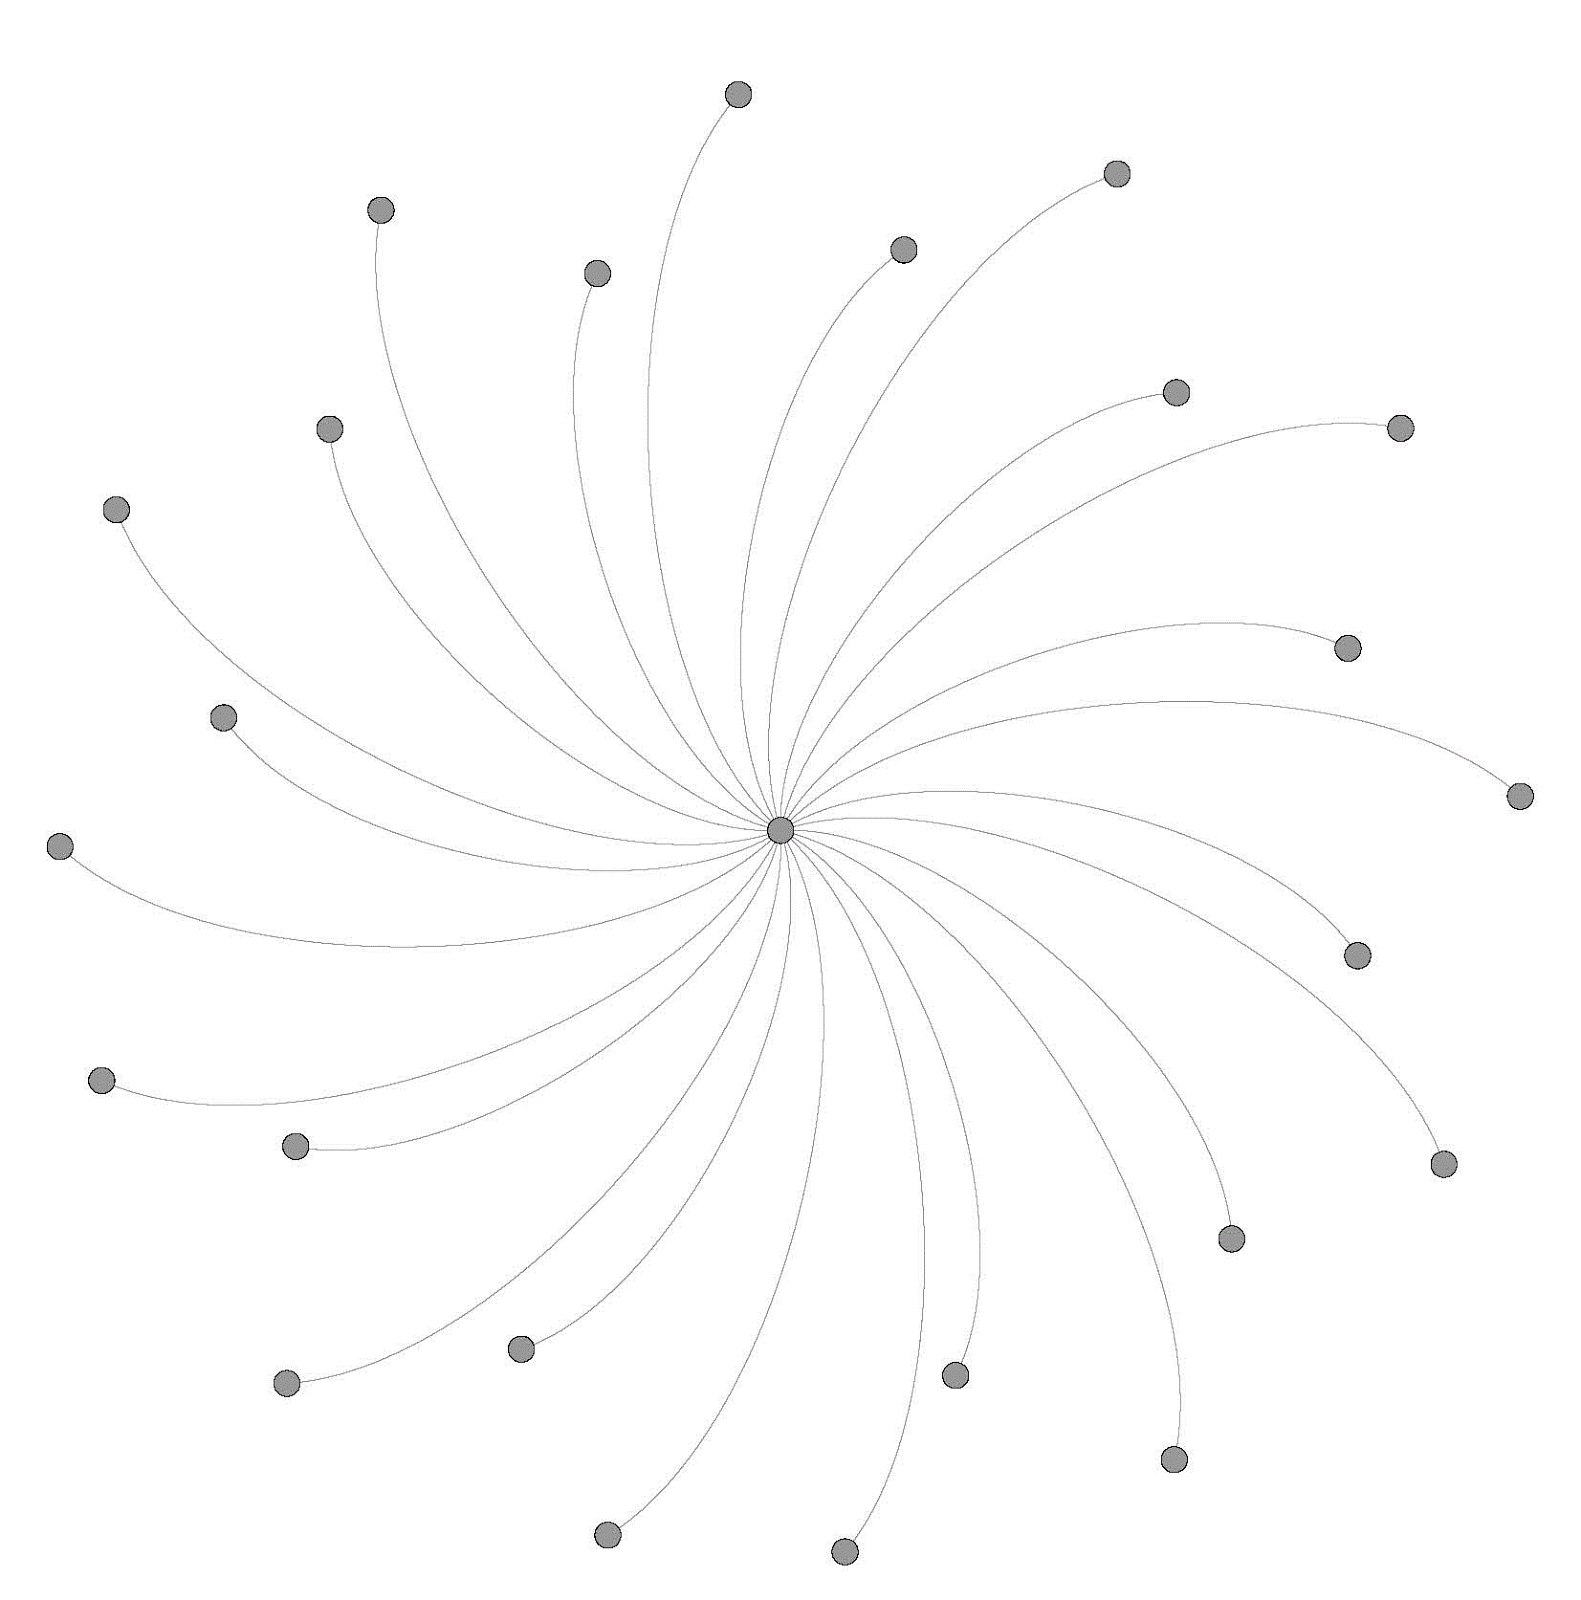
At this point, if you imported this file in a graph visualizer of your choice, you would obtain something like that :

This graph is nice, as you get an instant view on the list of your friends, but not really interesting in terms of social network analysis. What is lacking is the relationships between your friends.
2nd step: clean your list and export it to html
For this part, we are going to use Openrefine in order to clean up a little bit the URLs. Your data should look like this:
Facebook knows the social network of more than a billion persons. If you are a Facebook user though, you have little tools to explore your own social network. We are going to see how, with a few scraping tools, a Neo4j graph database and Linkurious, we can visualize our Facebook network.
There is no easy solution to visualize your Facebook network. Facebook is restricting access to its API. As a result, Netvizz, an application to visualize one’s Facebook network, was recently discontinued. Visualizing your Facebook network has become hard.
Hervé Piedcoq, data analyst and OSINT expert is going to show you a method to 1) collect, 2) store and 3) visualize your Facebook network.
Collecting the data to build your Facebook network
1st step : download your friends’ list
We will use OutWit Hub, a powerful yet easy to use scraper, based on Mozilla and XUL. It has built-in functionalities such as table and list detection, an extractor engine based on the source code of a web page, macros and job tools.
We could, of course, use Python or other languages to scrape Facebook, but OutWit Hub is clearly non-programmer oriented and immediately operational.
Connect to your account via OutWit Hub and display the complete list of your friends.

OutWit Hub uses the source code of the webpage to scrape the data. The problem is that Facebook uses a lot of Javascript that pollutes the code and really makes it hard to analyze.
A good way to avoid this issue, is to save this webpage in HTML on your hard disk and open it as a static page in OutWit Hub.
On the left panel, click on “links” (“Liens” in french), to grab all the links present on this page.

Filter these links using this regex in the bottom left corner box :
/(\?href|&href|hc_loca)/
Now export the selection to a csv file.
Simply replace the values in the column Url Source, with your profile ID, and rename it “Source”. Rename Url Page as “Target”.
At this point, if you imported this file in a graph visualizer of your choice, you would obtain something like that :
This graph is nice, as you get an instant view on the list of your friends, but not really interesting in terms of social network analysis. What is lacking is the relationships between your friends.
2nd step: clean your list and export it to html
For this part, we are going to use Openrefine in order to clean up a little bit the URLs. Your data should look like this:
Notice that FaceBook uses two types of URLs :
- the old one that contains profile.php in it;
- the new one that only contains the nickname.
This implies that we have to clean separately these two types of URLs.
Columns “Source” and “Target” won’t change but we are going to build a third column “C”, based on column B and A. This column will contain a link to a special URL of Facebook, which displays the common friends between you and another friend.
Simply use a concatenate function to achieve that:
cells.value+"/
friends?and="+cells.value.partition("=")
Or:
cells.value+"/
friends?and="+cells.value.partition("com/")
The result should look like this:
Now we need to transform the URL column in a HTML link that can be easily parsed by OutWit Hub:
This will allow OutWit Hub to extract your common friends by visiting the HTML link.
Once it is done, export this project to HTML.
3rd step : scrape the data!
Open the HTML file in OutWit Hub. Notice that the URL column is seen as a link by Outwit.
Create a macro in OutWit Hub, that will parse every link on this page. It’s basically the same operations as Step 1, but automated.
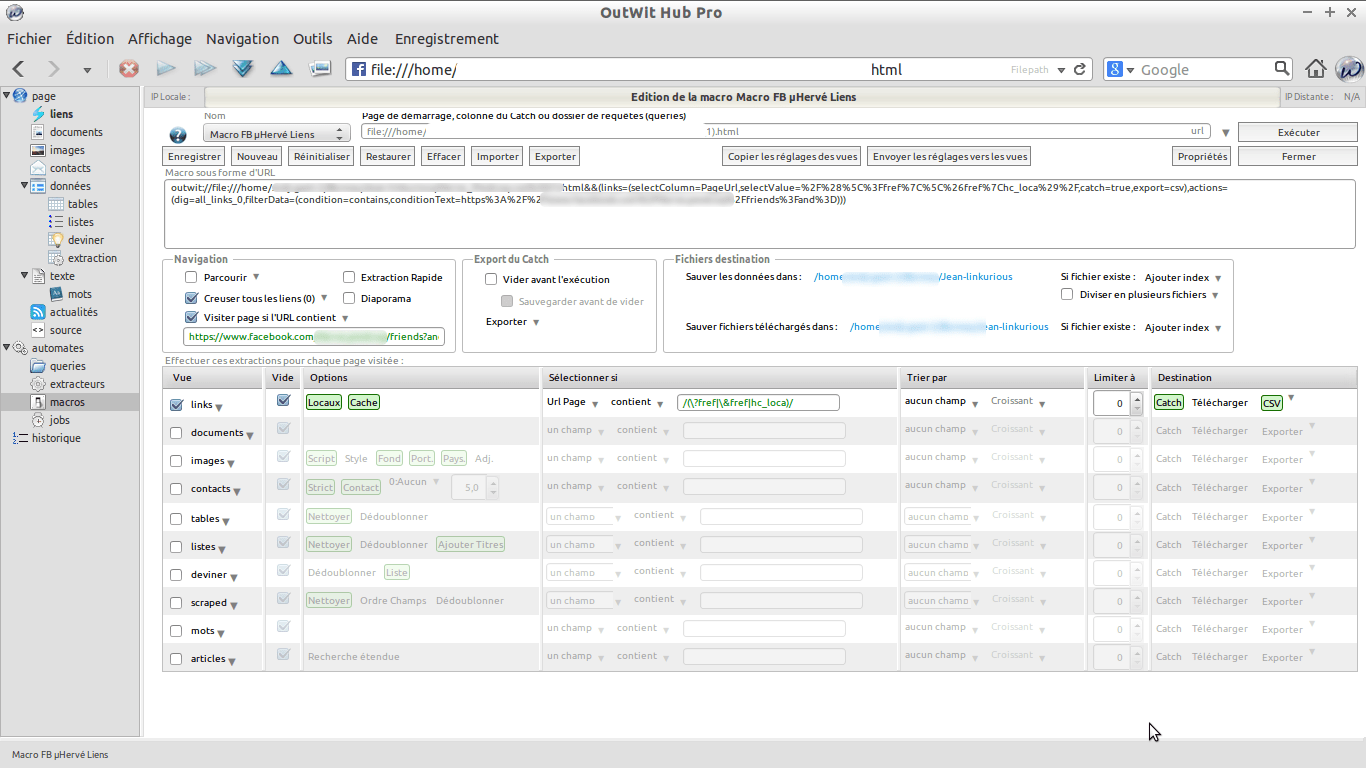
Depending on the number of friends you have and the machine you’re working on, this process may last several hours.
Once it is done, you will get a CSV file with your dataset. At this point, you may append this file with your initial list of friends (step 1), and clean the double entries that may appear, using Openrefine.
As you see, building a good dataset with Facebook is not really trivial, but can be achieved combining scraping and data-cleansing techniques.
Storing your Facebook graph in Neo4j
It is hard to understand the connections in your Facebook network with a tool like Excel. We are going to use Neo4j database to store the data.
Here is how to import your CSV-formatted data into Neo4j:
You can download the Neo4j dataset used in this article here. Now we can search and visualize our network.
Visualizing your Facebook graph
Neo4j offers an out of the box visualization tool. It allows you to visualize Cypher queries, a graph query language:
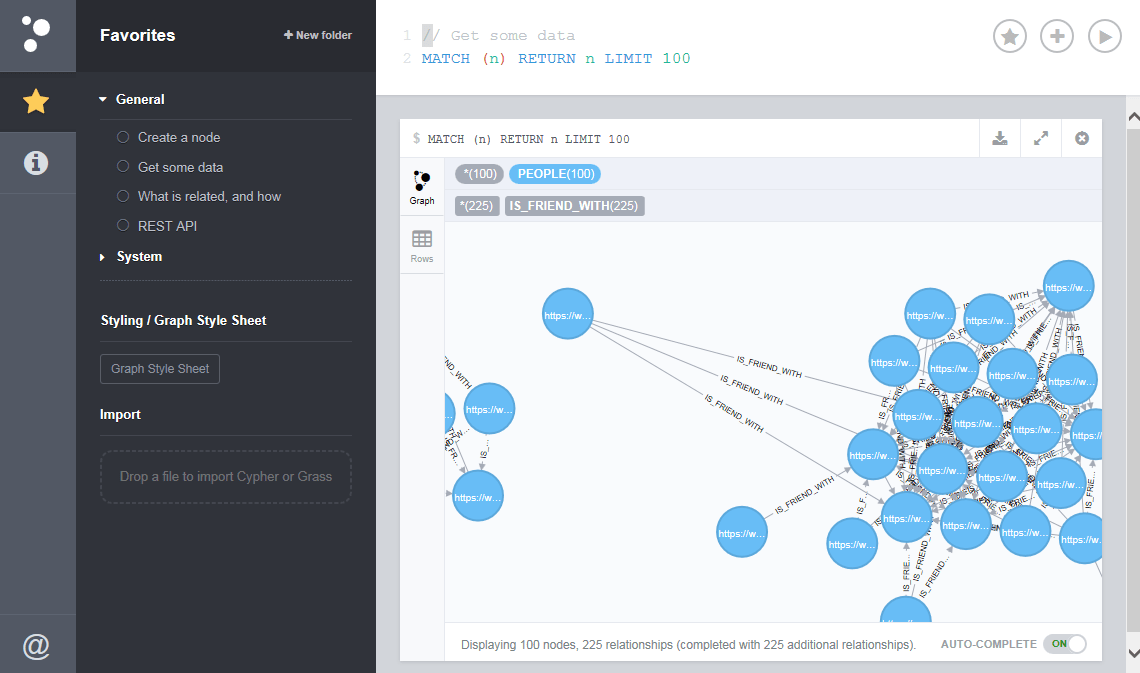
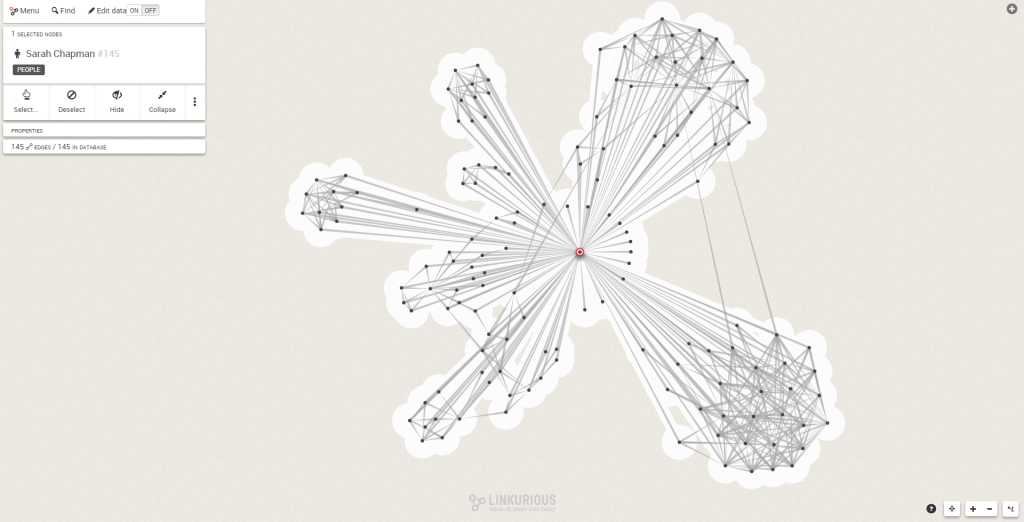
If you want something easier and more powerful, you can use Linkurious to explore your Facebook network.
Simply type the name of any of your contact, and you will visualize him.
We can also zoom on particular details.
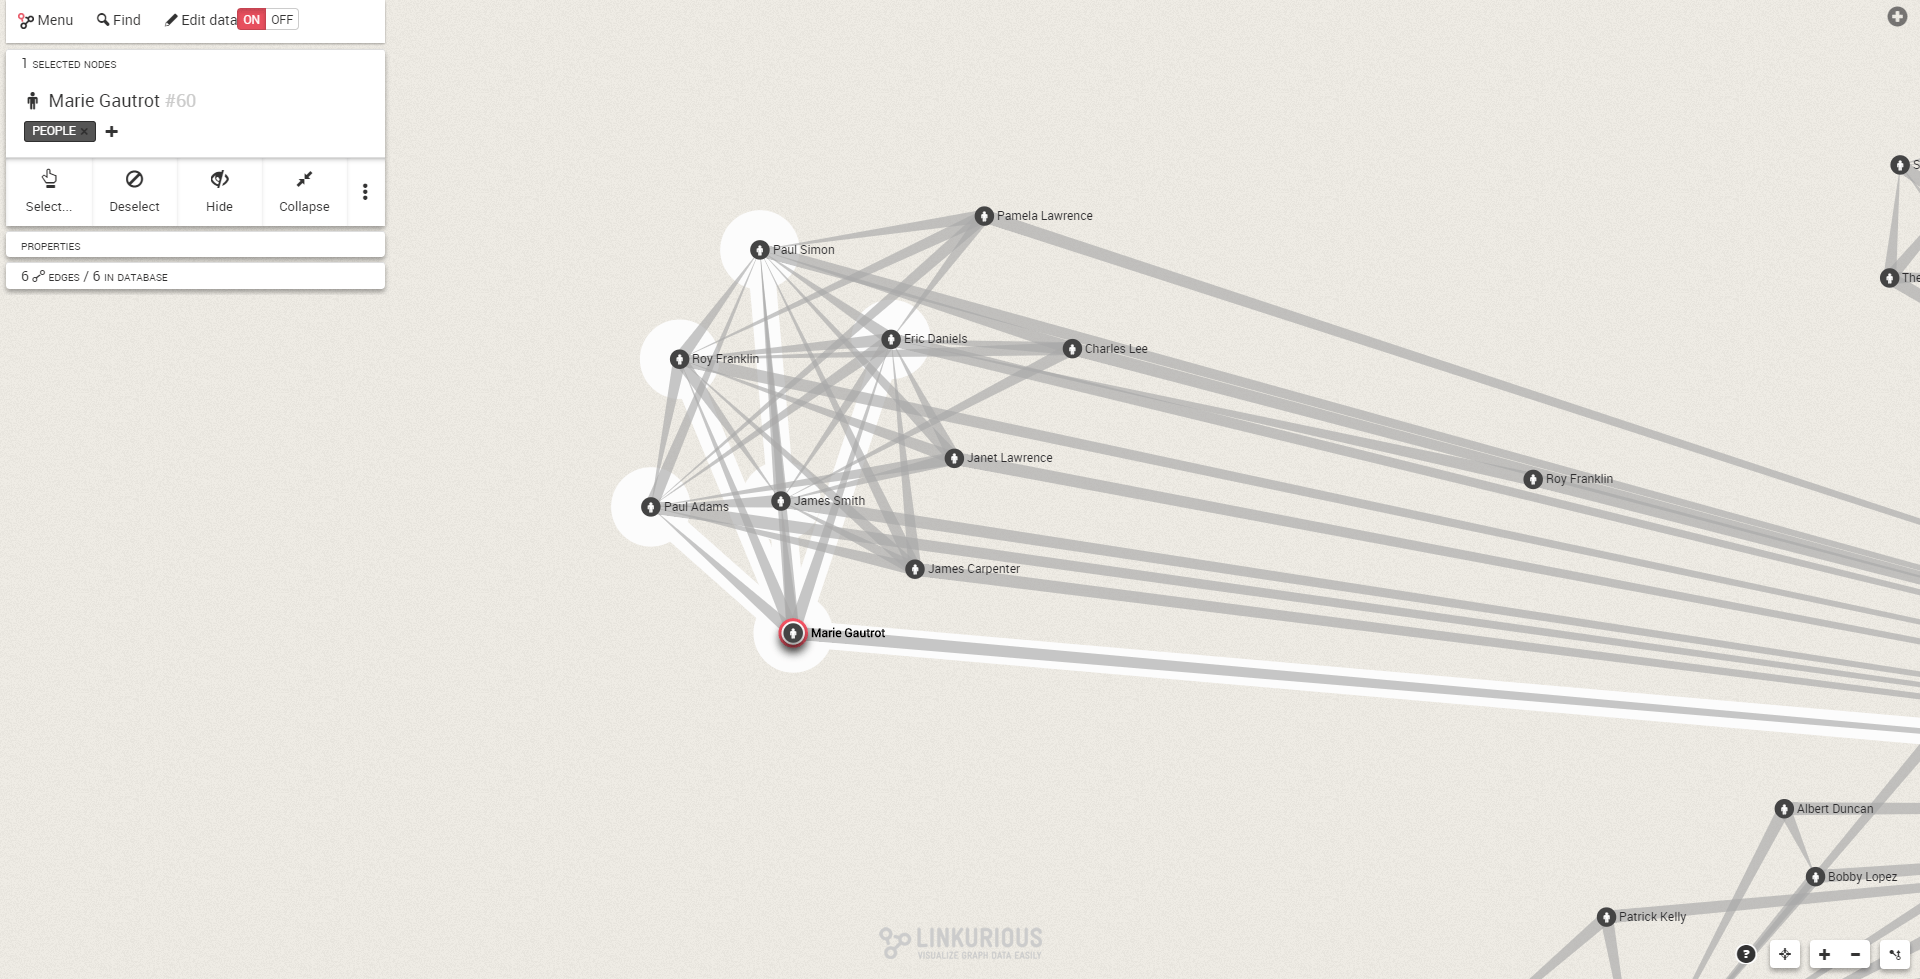
You can select nodes, hide them based on their properties. You can search for paths between two persons. All via an easy to use interface.
Graph visualization allows you to understand your social network. You can see who knows who. Who has a lot of connections. Who is isolated. What are the communities within your network. All of this can be discovered through visual exploration.
Follow Hervé Piedcoq to stay up to date on data investigation techniques and tools. You can check out our demo and learn how to use graph visualization to understand your data.
A spotlight on graph technology directly in your inbox.