How graphs can power drug prescription
Doctors and health care providers are tasked with a very difficult task. They have to choose from an ever increasing supply of drugs which to administer their patients. Choosing the right drug involve checking for potential negative interactions between the drug (or drugs) and the patient traits. That process can be optimized with the help of graphs.
How complex is it to choose the right drug
To treat a common cold, a doctor has a few well know options he can choose from. Choosing the right drug here is routine for him. But a lot of situations are more complex. To treat the patient, he may have to combine different drugs. Combining them could be dangerous though, he has then to anticipate how they are going to interact. Furthermore, the patient may have special traits. The doctor has to consider their impact : pregnancy, allergy, age, condition.
Choosing a treatment involves a deep understanding of the connections between drugs and patients. Making a good decision here is literally a matter of life and death. Thankfully, graph technologies can help. They make it easy to analyse the connections in complex datasets to provide clear answers. Graph search, the same logic used by Facebook to tell you which of the friends of your friends can recommend you a great Sushi place in Paris, can be used to provide accurate drug prescription.
A graph data model for drug prescription
In order to demonstrate how to use graphs to provide drug recommendation, we’ll use a GraphGist project put together by Alberto Roque Carrizo Fernández and Luis Martínez Menéndez. It details the new computer system to dispense drugs in the HUCA (Central Hospital of Asturias). Their great work is based on Neo4j, an open-source graph database.
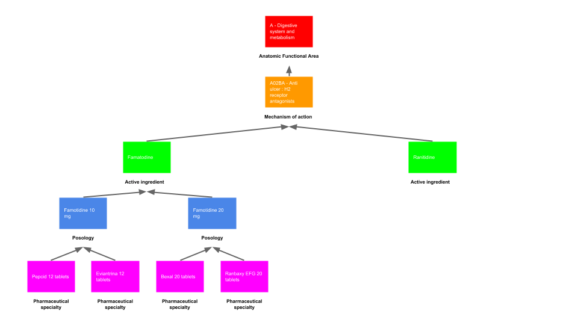
How did they decide to represent the complexity of the drug interactions? They used a graph data model. A graph is a way to represent data as nodes linked together by edges. The graph model we are going to see is based on the anatomical functional area the drugs affect, it is called the Anatomical Therapeutic Chemical Classification System (ATC).
There are 5 layers of information in the classification :
- the functional area : organ or system a drug acts on ;
- the mechanism of action : the specific biochemical interaction through which a drug substance produces its effect ;
- the active ingredients : he substance in a pharmaceutical drug or a pesticide that is biologically active
- the posology : the appropriate doses of drugs ;
- pharmaceutical specialty : a commercial drug ;
Here is a schema that shows how the drug data is modeled :
Alberto Roque Carrizo Fernández and Luis Martínez Menéndez came up with this great model. They have also created a small dataset that includes a few drugs stored in a graph. You can download it here if you want.
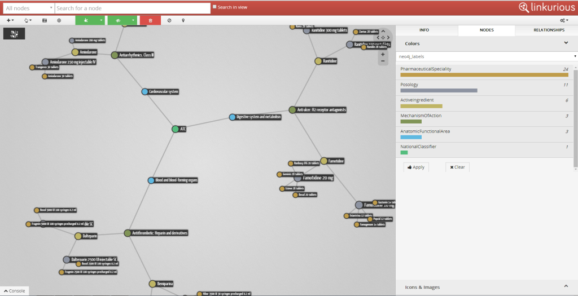
That dataset will help us demonstrate the kind of sophisticated queries enabled by graph technologies.
Graph-based search for drugs
We can use the graph structure of our data to ask questions about the connections of a particular object. For example, we might want to know the active ingredients of a given mechanism of action. To get the result, we’ll use Cypher, a query language optimized for graphs :
MATCH (n:MechanismOfAction)–>(i:ActiveIngredient)
WHERE n.name = "Antithrombotic: Heparin and derivatives"
RETURN i.name AS Name
The answer to our question is Bemiparina and Dalteparin. These are the 2 active ingredients of Antithrombotic mechanism of action. Here we have simply looked up the direct connections of a given node in our graph.
Let’s ask a more complex question now. As an hospital, we’d like to cut down on the cost of drugs. Can we do it without impacting the quality of services provided? One solution is to choose the least expensive drug for each given mechanism of action. What is the least expensive medicine for each mechanism of action? The graph can help us answer that question :
MATCH (n:MechanismOfAction)-[*]->(i:PharmaceuticalSpeciality) WITH n, min(i.price) AS Price
MATCH (n)-[*]->(i:PharmaceuticalSpeciality)
WHERE i.price = Price
RETURN n.name AS `Mechanism of action`, i.name AS `Medicine`, Price
ORDER BY n.name ASC
The result is :
That would be a nice list of drugs that the hospital would want to recommend its doctors to use.
This time we have traveled in little further in the graph. We started with a series of mechanisms of action, looked up the active ingredients they are connected to, looked at the posologies they are linked to and then, finally looked at the individual medicines they are linked to. What’s great about graph databases is that that query can be executed very quickly. The ability to sort the results according to a property is a nice addition too!
Let’s say now that as a doctor we want to prescribe an anti-ulcer to a patient. Unfortunately he has a small allergy. We must not prescribe a drug containing the active ingredient Famotidine. That means that we need to find an anti-ulcer drug that doesn’t contain Famotidine. Once again, to obtain the answer we need to travel in our graph. Except that this time we’ll have to discard all the paths going through Famotidine.
Let’s see how to do it :
MATCH (n:MechanismOfAction)–>(a:ActiveIngredient)-[*]->(i:PharmaceuticalSpeciality)
WHERE a.name <> ‘Famotidine’
AND n.name = ‘Anti ulcer: H2 receptor antagonists’
RETURN i.name AS `Medicine`, i.price AS Price
ORDER BY Price ASC
We get 4 results, including “Terposen 28 tablets” which is the cheapest.
These few queries should show the potential of graph-based search for drug prescription. We have worked with a very small dataset here. Doctors and hospitals are dealing with much more data. Graph technologies could help us answer their questions faster and with more precision.
Using drugs appropriately is both hard and dangerous. It involves understanding complex interactions. The human brain is not designed for this. Even traditional databases have a hard time dealing with connected data. With graph technologies on the contrary, querying connected data can be very natural. Try it if you’re working with graph data!
A spotlight on graph technology directly in your inbox.