Graph Viz 101: The non-linear data processing chain
Graph Viz 101 is a series of posts to teach the basics of graph visualization, written by Sébastien Heymann in collaboration with Bénédicte Le Grand of Université de Paris 1. This is our sixth post, please discuss it below!
Visualization alone is not enough
Visualization is part of a larger process to extract insights from data. A typical data exploration involves extracting, cleaning and sometimes merging various sources of data, then exploring data using multiple techniques, and finally rendering results for communication purposes. Visualizing data is embodied in these different stages:
- One must look at the raw data to understand how to process it and to identify obvious errors like character encoding issues and exceptions such as missing data.
- It is involved in the exploration process (see our previous post).
- It can be used to communicate insights through static –final– renderings or dynamic –interactive– systems.
Here we cover the main aspects of the data processing chain. From objects of study to discourses about them, analysts use a non-linear process which validity is questionable with regard to the multiple steps of data transformations. Moreover, the boundaries of the studied objects may be blurred by the use of multiple data sources and data mining algorithms which hasten visual analysis by using external concepts to describe data. The processing chain can be implemented by combining data manipulation with visualization through interaction features. While some standards emerge for interacting with graph visualization, time-varying (or dynamic) graphs raise difficult challenges. Divergent strategies are also adopted to cope with the technical and cognitive limits of visualization solutions for the analysis of large graphs. We will discuss these issues in detail in the following blog posts.
Non-linear data processing chain
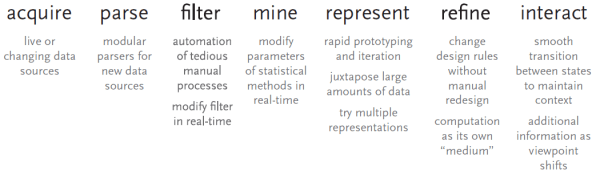
The process involved from data collection to information discovery requires a complete tool chain to acquire and parse data, filter, mine, then represent it and finally refine the visualizations interactively (Fry 2004), as illustrated in the above figure. Nowadays, companies and research laboratories have access to a large choice of methods and corresponding tools for each step. However their combination remains problematic because such variety makes the selection of the appropriate one difficult. Analysts must also learn how to use each new method properly, verify how to transfer data and intermediate results from one tool to another, check the integrity of the deployed processing chain to assess the validity of results, and eventually use the processing chain. Moreover, this process is usually not static but dynamic: one rarely knows in advance which methods are relevant for the data under study. The freedom of disorderly processes was advocated in (Engelbart 1962):
When the course of action must respond to new comprehension, new insights and new intuitive flashes of possible explanations or solutions, it will not be an orderly process.
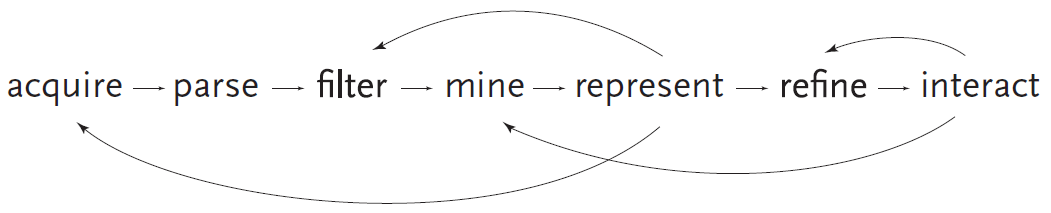
Hence the process implies much trials and errors using various methods before discovering new information. As new questions and knowledge emerge during this process, each step must be modifiable at any time. Visualization may indeed reveal the need to acquire more data, or filter it in another way; interacting with it may require to change visual variables and aesthetics. Computing basic statistics and proceeding to an early visual exploration of data before performing more specific analysis can thus provide relevant hypotheses to start with. The interaction may also highlight new statistical patterns, hence requiring new visual refinements. This problem is clearly summarized by Ben Fry on the following figure. However the validity of such process is questionable.
An epistemological perspective on the data processing chain
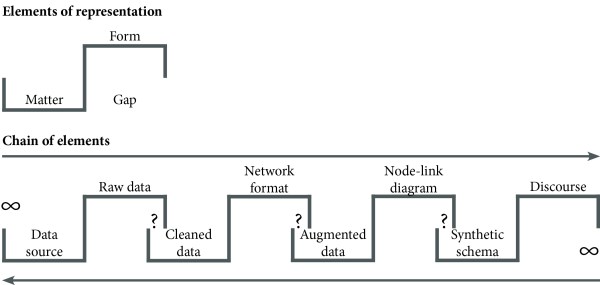
How is the data processing chain able to generate valid information on the objects of study? With the multiple steps involved from “raw” data (which are already constructed from such objects) to final representations, it is surprising that analysts’ discourse on objects of study can still be related to the objects themselves. An important theory to solve this epistemological problem was coined in (Latour 1995) with the “chains of circulating reference”. By observing how scientists transform the soil of Boa Vista forest into scientific facts, Bruno Latour has remarked that scientific studies follow a series of transformations, each one going from matter to forms by creating a gap: forms lose material properties, but gain semiotic properties related to that matter. In this perspective, reference is a property of transformation chains which depend on the quality of transformations. Such chains can conduct truth only if they remain reversible, i.e. changes can be traced back and forth so that valid reference circulates along chains without interruption.
The circulating reference was originally illustrated by Latour on the Boa Vista study. We revamp his schema on the figure below, in an attempt to apply it on the processing chain of graph data. We will see in the next blog post how augmented data (which is part of this chain) generated by data mining algorithms may hasten visual analysis.
We have seen that knowledge emergence is not a trivial process. It involves many back-and-forths between data, statistics, and visual representations. The ability to extracting “facts” or “proofs” from data is tightly bound to the employed method and should always be challenged. In the following blog post we will see how data mining algorithms and interactive systems are able to speed up investigations on graph data.
A spotlight on graph technology directly in your inbox.