Graph-based Enterprise Architecture Visualization
In this post, we explain how a graph-based approach to Enterprise Architecture is helping specialists make sense of complex data through visualization and analysis of connected data.
Enterprise architects must deliver insights quickly and make sense of large amounts of enterprise data (business knowledge, application information, technology assets, etc). In this context, understanding and modeling interdependencies between entities is key. With relationships at the center of their model, Enterprise Architecture visualization tools are ideal to drive change and innovation in complex environments.
EA: Managing change & complexity
Where startups start with a blank page, mature organizations have to accommodate a complex set of objectives, infrastructures or processes when they consider change. Unmanaged, this complexity turns into paralysis and eventual replacement by more agile competitors. That’s why enterprise architecture is necessary for business or IT executives who need to balance the need for innovation with security and operational efficiency.
Typically an Enterprise Architecture is divided in 4 domains: business architecture, data architecture, applications architecture, technology architecture.
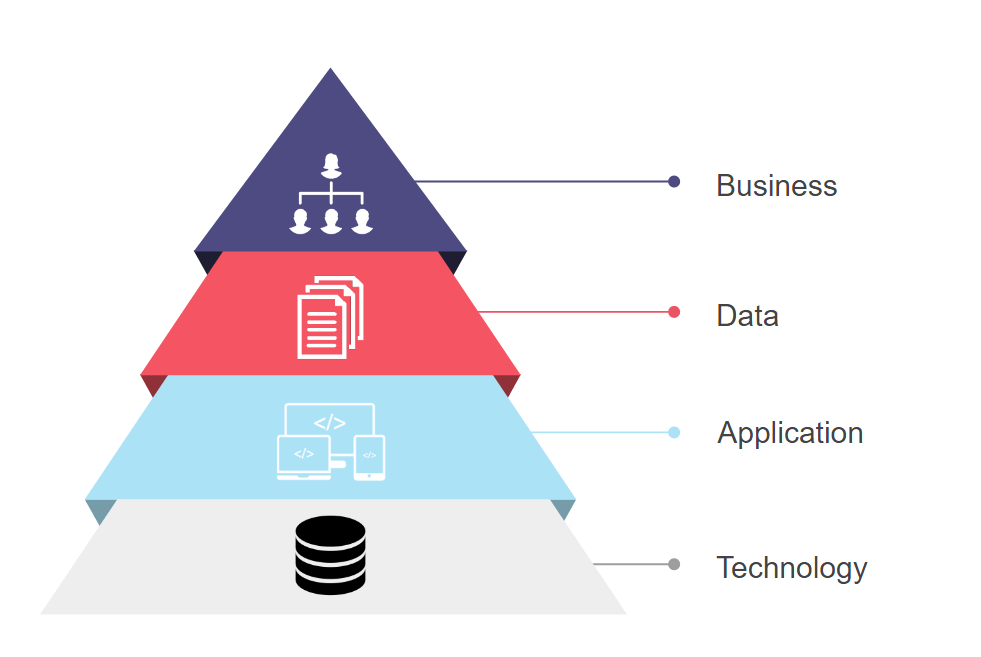
Taken separately each layer has its own complexity. The technology architecture, for example, describes the hardware and network powering an organization’s applications. This is the domain of network engineers and network management. It involves mapping servers, devices, systems, locations to build an accurate picture of the network infrastructure. Understanding the interdependencies within the network infrastructure is necessary to diagnose failures or identify anomalies. As the network grows, it becomes harder and harder to minimize interruptions and guarantee security.
These issues are compounded when you start considering the interdependencies across the whole enterprise architecture. If a new product is released, how will it impact the data, application and network layers? If a datacenter is experiencing outages, what are the impacts on the applications, data and business architecture?
Today enterprise architects are struggling to tackle growing complexity. Symptoms include:
- inability to understand interdependencies within enterprise architecture;
- inability to adapt enterprise architecture to changes;
- Inability to implement analytical queries due to performance issues;
It results in lower organizational agility with new projects failing and difficulties in driving innovation.
From a relational approach to a graph approach
A big part of the problem is the lack of a single unified view of the enterprise architecture data. Information is scattered in siloed tools (landscape map, CMDB, system inventories, UML tools, process chain, balanced scorecard, etc). The reason for that? They are often backed by relational databases. Using tables to structure information makes them ill-suited “to deal with data that is rapidly changing not only in content, but in structure”.
Graph technologies provide a natural advantage to enterprise architects. The graph model uses nodes and edges to store data. This is a natural way to think about the interdependencies of enterprise architecture with very concrete benefits. Graphs and Enterprise Architecture visualization tools have the following advantages:
- unified view of enterprise architecture means there are less blind spots due to siloed information;
- more flexible model means that it’s easier to adapt to changes (update your EA meta-model or adopt new frameworks for example);
- advanced rule-based analytics to deliver insights faster and more easily (eg running impact analysis)
Empowering organizations with Enterprise Architecture visualization
At Linkurious, we are already supporting a number of organizations who are building their enterprise architecture based on a graph approach. Linkurious Enterprise is an off-the-shelf Enterprise Architecture visualization solution to search, edit and visualize graph data. Directly compatible with graph databases such as Neo4j, JanusGraph, and Cosmos DB, Linkurious Enterprise supports the security, scalability and extensibility constraints of large organizations.
What we have learnt is that it’s not enough to build an accurate enterprise architecture. The real difference happens when enterprise architects and business can:
- investigate the data intuitively to answer questions;
- monitor the data to identify anomalies or problems quickly;
- curate the data in real time;
- share reporting that speak to decision-makers;
- collaborate and work securely.
This leads to a more transparent enterprise architecture, faster and better decisions and greater agility.
Visualization of Enterprise Architecture data in Linkurious
In order to see what using graph technologies can bring to Enterprise Architecture, let’s look at a fictitious situation. We fabricated a dataset of Enterprise data. The architecture in our example is composed of our four different enterprise layers: business entities in red, application entities in blue, data entities in grey and technology entities in purple. The different components of this network are linked through dependency relationships, as depicted below.
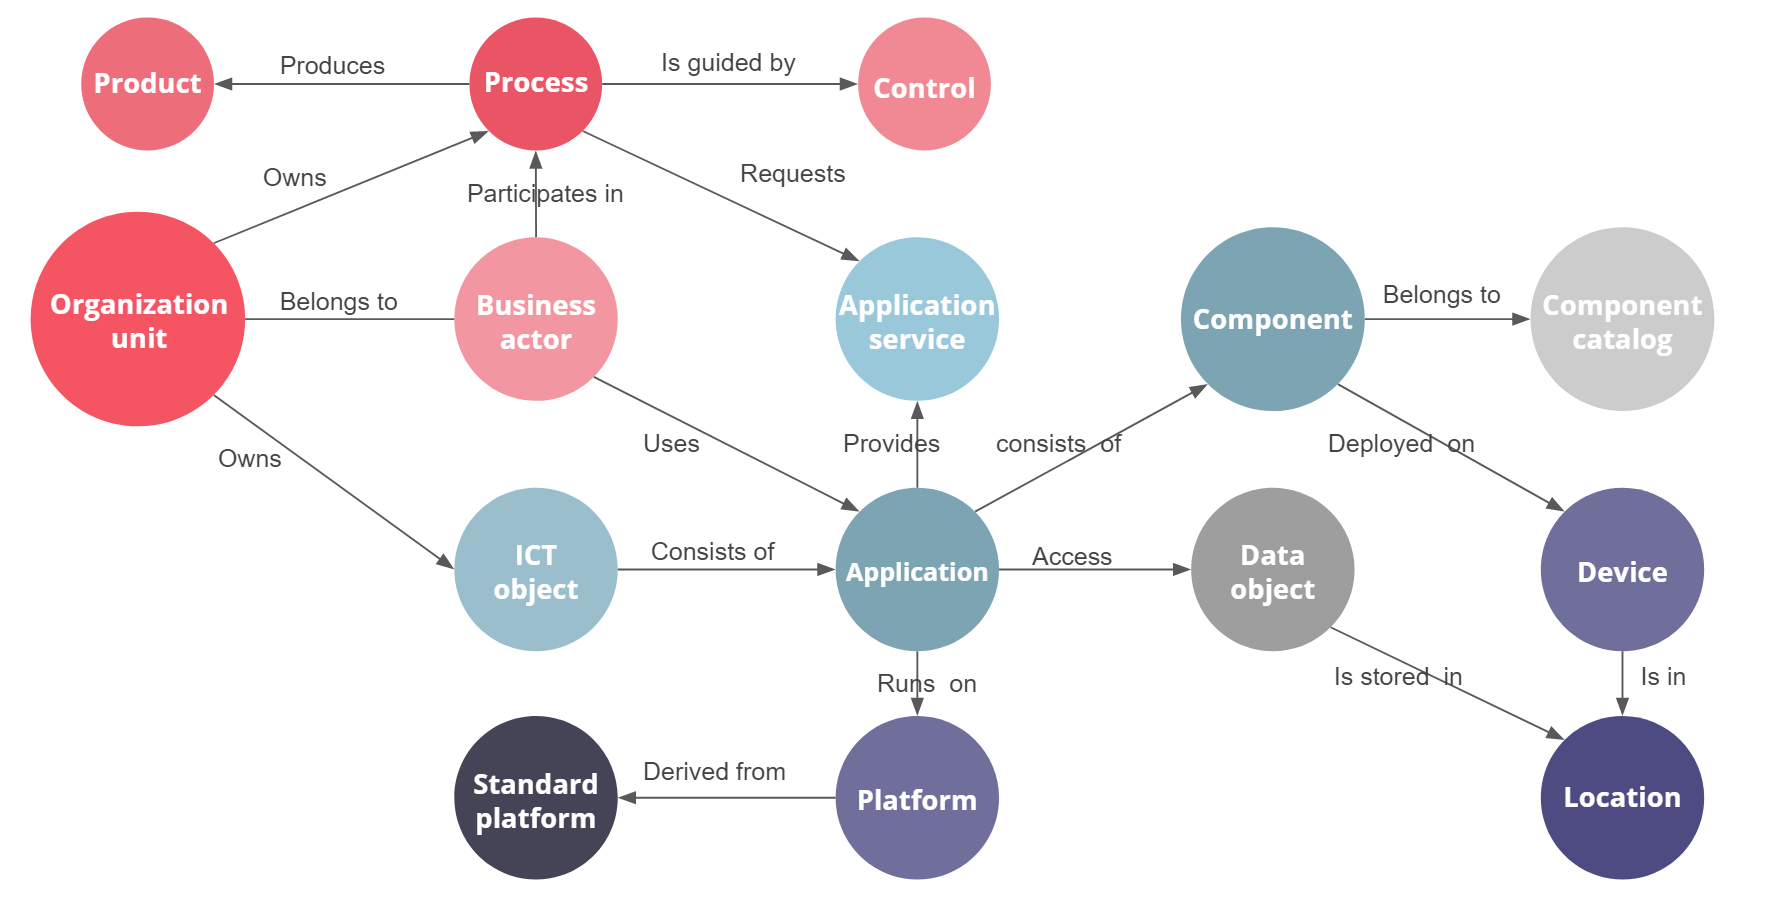
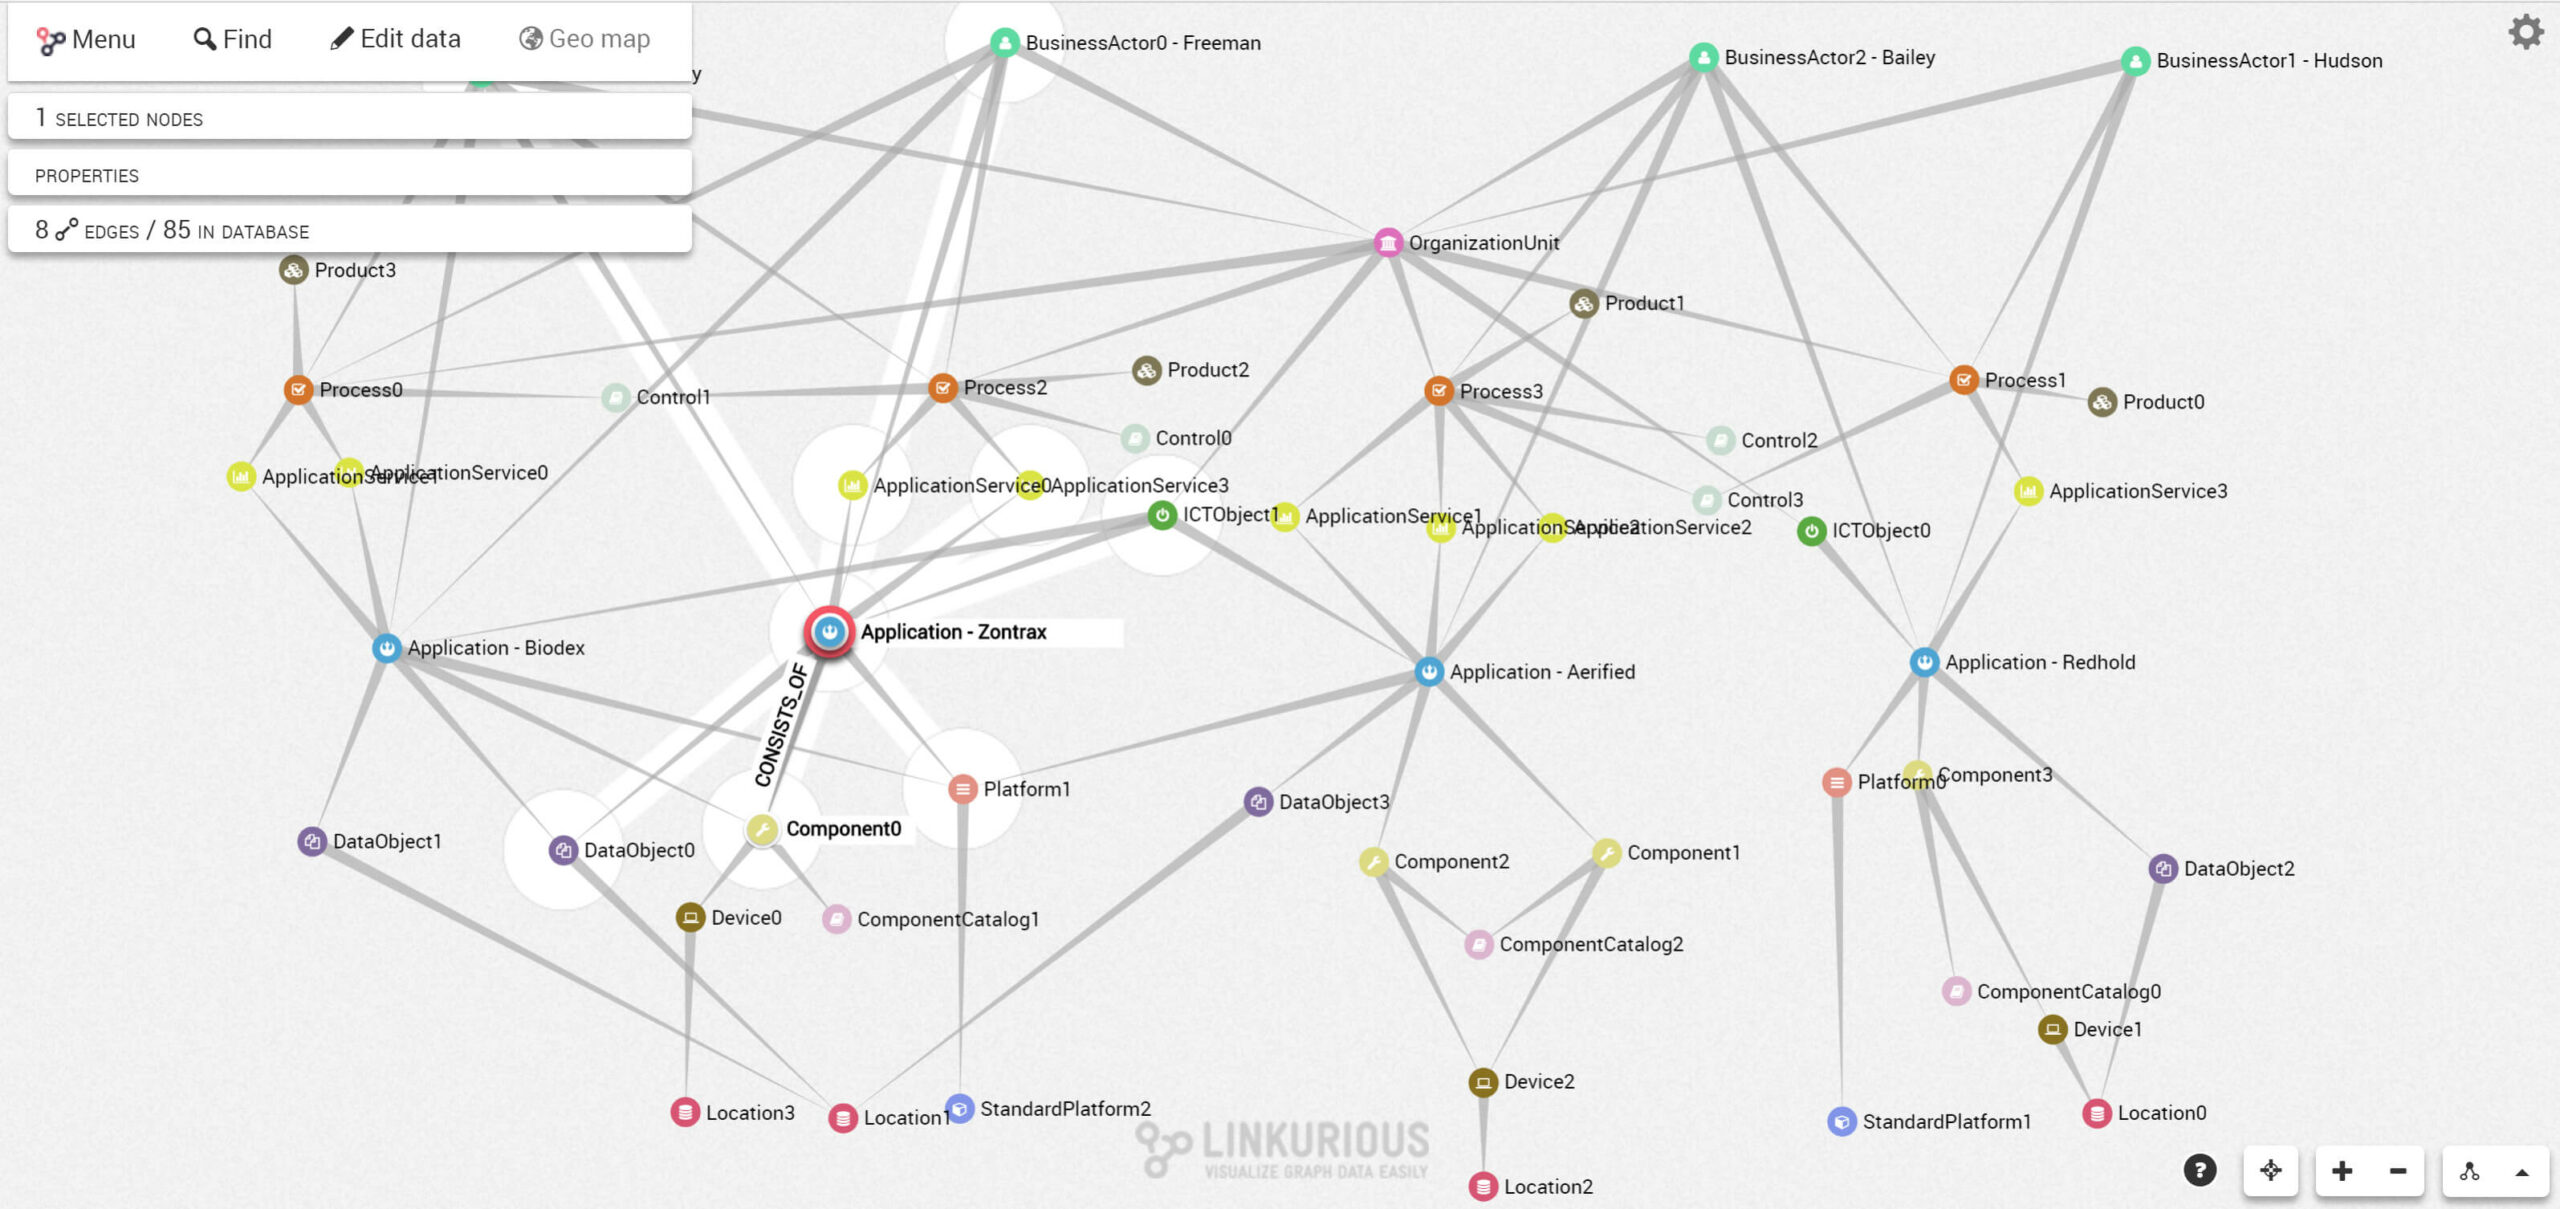
This model serves as a basis to import our data into a graph database. A simple script allows us to model and import our data into Neo4j. Linkurious platform then automatically connects and synchronizes with the graph database so that architects directly get global and dynamic overviews of their architecture data. They can investigate and understand in a glimpse the interdependencies between enterprise entities.
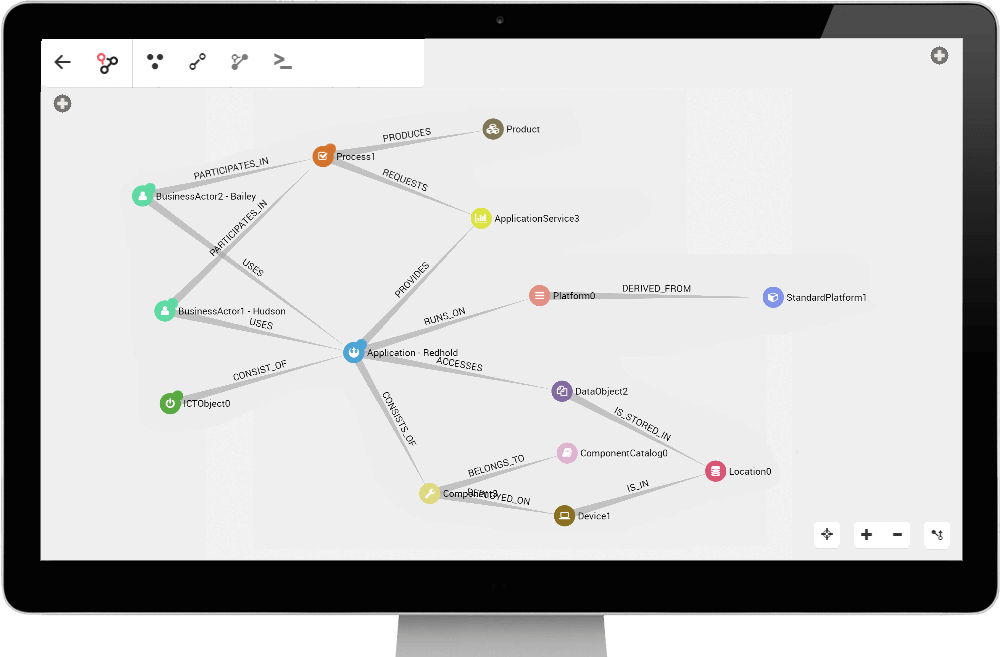
Running impact analysis in Linkurious Enterprise
Dynamic visualization can help understand the impact of change. In Linkurious, architects can explore subgraphs to visually understand interdependencies in the system. For instance, let’s say I was asked if my asset “Location0”, a server, could be removed. Architects need to be able to answer questions as: “What is the impact on my business processes if we modify our infrastructure by removing a server?”. On the image below, we quickly understand the impact removing “Location0” can have on the different enterprise layers.
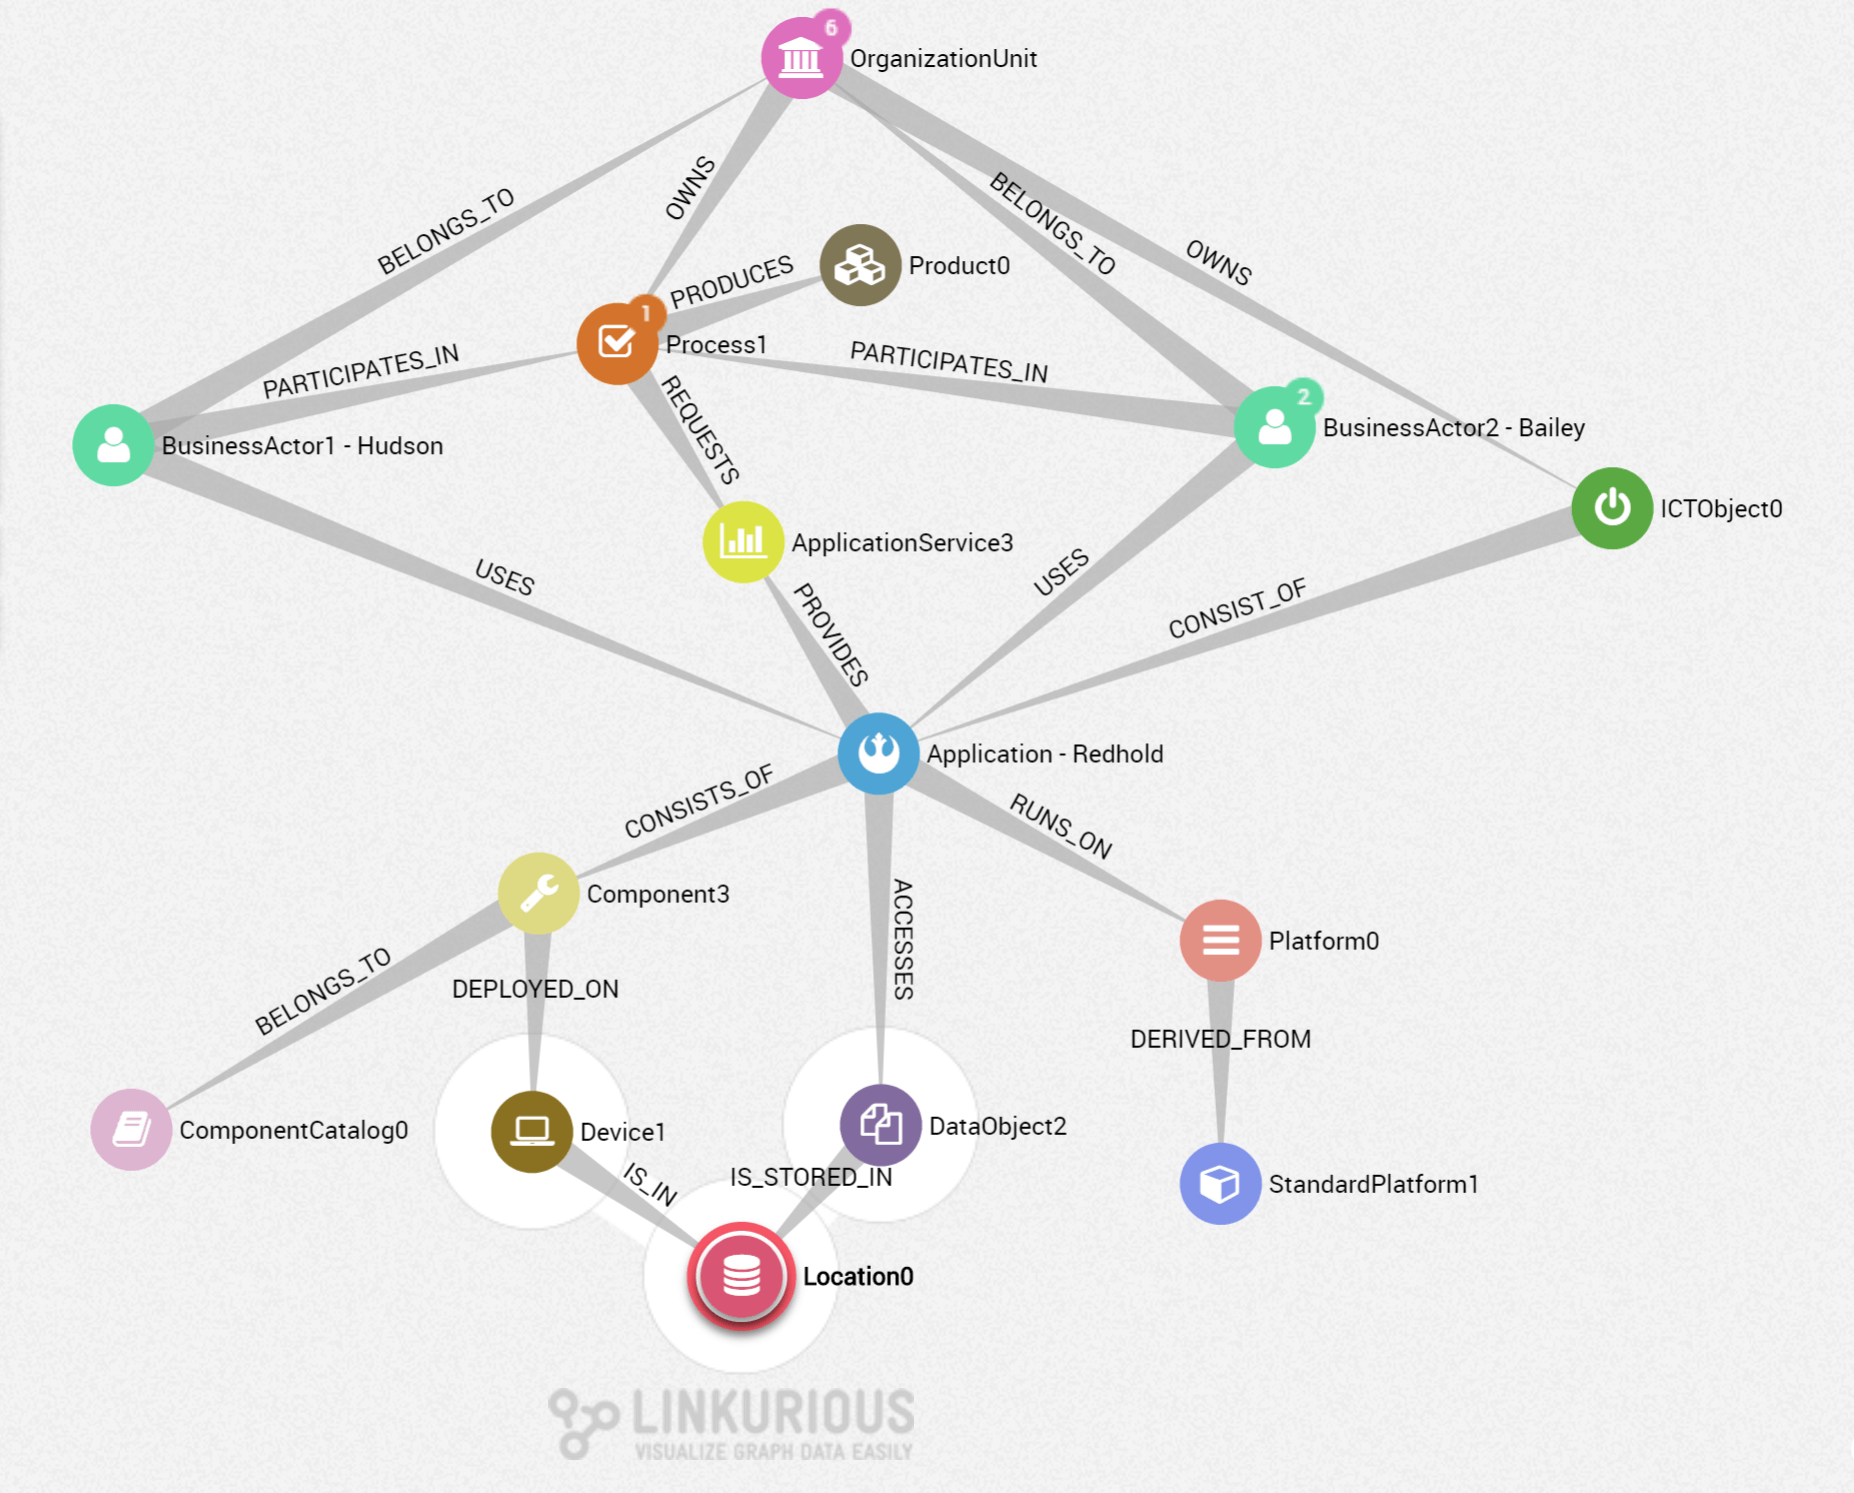
From technology to business layer, removing the “Location0” will have important impacts. The application “Redhold” accesses a data object that is stored in “Location0”. So indirectly the removal of the server will have consequences on the running of the application and therefore on the services that it provides and eventually on business processes.
Teams can collaborate on such projects. Architects can share their finding with other directly in Linkurious and produce reportings. They can customize the data to display an easy-to-read graph (icons, color, names) and share the graph with decision makers.
Tame your enterprise architecture with Linkurious
Embracing organizational change is a strategic and competitive advantage for organizations. For businesses with massive volumes of data and digital assets, Linkurious Enterprise Architecture visualization platform provides a foundation for a scalable EA. From Enterprise Architecture project management to impact analysis or project planning Linkurious offers a solution to map, search and visualize enterprise architecture.
Contact us to discuss your project or start an evaluation of Linkurious Enterprise.
Part of this article was initially published on Neo4j’s blog.

A spotlight on graph technology directly in your inbox.