Connecting the dots: Using graph to visualize and analyze intelligence data
In the age of big data, intelligence analysts working for national security or law enforcement agencies have massive amounts of diverse information they need to synthesize and make sense of. Traditional relational databases and analysis techniques struggle to handle the volume and interconnectedness of modern-day intelligence data. But graph technology offers a powerful solution to manage and derive insights from complex datasets.
In this article, we explore how graph databases, visualization, and analytics can enhance intelligence analysis, allowing analysts to see connections and patterns within a unified graphical representation. The ability to interactively explore data using graph unlocks new opportunities for intelligence analysts to derive value from massive quantities of interconnected data. Through real-world intelligence use cases, we also illustrate how tools like Linkurious Enterprise leverage graph technology to support investigations, target analysis, and other analytical tasks. We show how analysts can quickly query the data, examine connections, and perform forensic analysis at scale.
Intelligence collection and analysis in the age of big data
Digital transformation has brought new possibilities for intelligence, surveillance, and reconnaissance across both traditional and new intelligence sources. The possibilities of collection within each discipline have widened. For instance, the Open Source Intelligence (OSINT) collection channels multiplied with the Internet, providing access to valuable new information. Digital transformation has also produced huge amounts of new data (think about the now widespread use of portable devices), which has in turn created new collection and analysis opportunities.
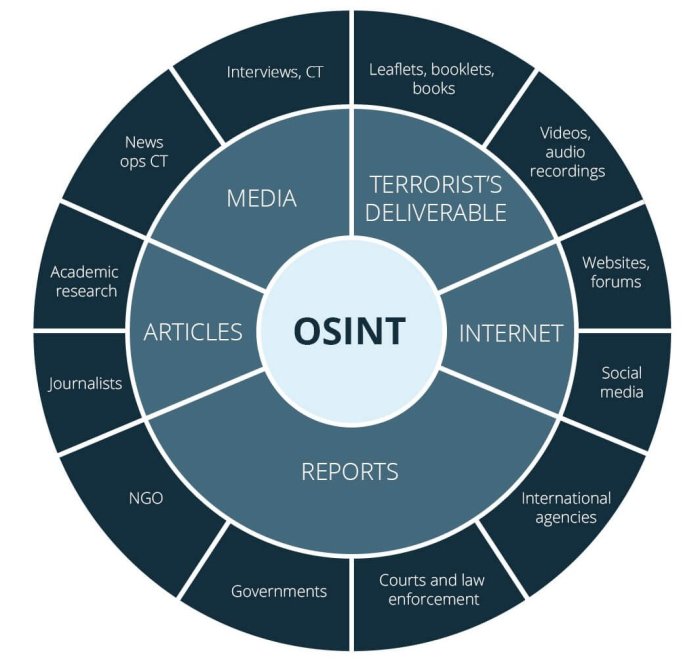
But while those changes represent an opportunity for gaining essential insights, they also come at a cost for intelligence analysts:
- More data requires additional processing efforts because unprocessed or unstructured data is unusable and thus worthless. And new data is constantly being collected, requiring regular updates and processing.
- Once processed, those data collections are often sizable. This complicates and slows down the identification of relevant entities. And if the tagging or indexing isn’t done properly, effective analysis can be impossible.
- Finally, data is disparate and scattered across silos, and it exists in a wide variety of formats. This diversity turns multi-intelligence, or all-sources analysis, into a tedious task: how to draw connections between two, ten, or a hundred pieces of data when they are present in different tools?
These challenges have a direct impact on the analysis. It’s difficult and time-consuming to handle large, dynamic and heterogeneous data assets. And in the meantime, the complexity of security threats remains the same. To identify them, analysts must be able to cross-check various data assets in order to spot key elements, relationships, and patterns that will produce actionable intelligence.
Graph technology to enhance intelligence analysis
In this context, intelligence analysts are turning to new tools and methods to improve the traditional intelligence cycle. Graph technology is one of the tools that’s proving to be a game-changer for analysts managing large quantities of disparate data.
Graph has emerged in recent years as a powerful tool for deriving insights from connected data. Whereas traditional relational databases are optimized for transactional queries, graph databases are purpose-built to traverse relationships efficiently. This makes graph technology particularly well-suited for intelligence analysis use cases, as they rely heavily on analyzing complex webs of people, places, events, and other entities.
The graph technology approach relies on a model in which data is structured as a network. Individual data points are stored as nodes, connected to each other by edges representing their relationships. Both nodes and edges can have various properties associated with them.
This graph structure mirrors the natural connectivity of intelligence data. Analysts can load this data into a graph database and then quickly traverse relationships and patterns. This enables them to uncover hidden connections in the data, generate new investigative leads, and ultimately gain a deeper understanding of complex situations.
Graph database: gathering your data in a single model
Graph databases are optimized for the storage of connected data. They emerged as the answer to the limitations of relational databases, which were designed to store tabular structures. While they are very good for this purpose, they do not perform well when it comes to handling large volumes of connected data.
Graph databases, on the other hand, offer several advantages over traditional technology when it comes to connected data:
- Performance: These systems are designed to handle data relationships and they greatly improve the performances when it comes to querying data connections.
- Flexibility: Graph databases easily accommodate rapidly scaling data. You can enrich or change the data architecture as your requirements evolve.
Examples of popular graph databases include Neo4j, Azure Cosmos DB, AWS Neptune, and Memgraph. These systems have been widely developed over the last decade, responding to the growing need for a technical solution for organizations working with connected data at scale.
With graph technology, you can combine multi-dimensional data, including time series, demographic or geographic data. It aggregates data from multiple sources and formats into a single, comprehensive data model that can scale up to billions of nodes and edges.
Graph databases and intelligence data
These capabilities are essential in multi-intelligence or all-source analysis to identify suspicious patterns, anomalies or irregular behavior. Indeed, suspicious activities are easier to detect when you analyze the dynamics between entities and not just the characteristics of single entities. With this approach, analysts can easily gather and analyze data about people, events, and locations into one view.
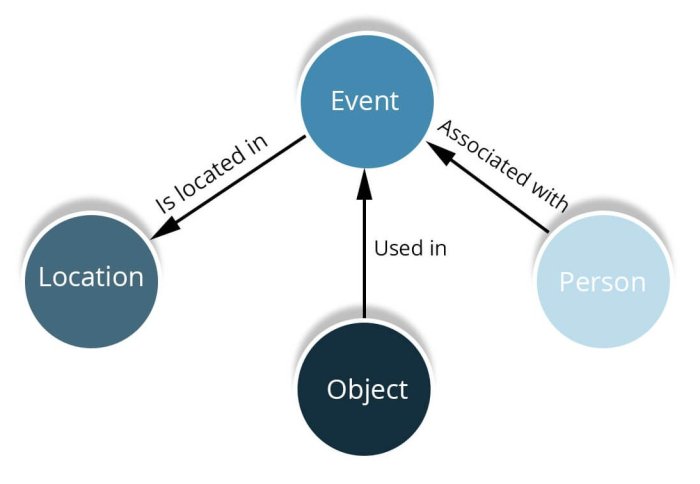
Graph technology offers several key advantages to intelligence and law enforcement agencies. It provides a single entry point to multiple data sources and data types that are integrated under a unique model. Analysts can produce intelligence from the analysis of heterogeneous data and its connections.
Introducing graph databases into an organization comes with a set of new challenges, however. Unless you have a technical background, performing complex analysis on connected data can seem daunting. That’s where graph visualization and analysis tools come in handy.
Graph visualization and analytics: extracting insights from connected data
While the graph approach offers a unified model, finding insights in enormous volumes of data remains a challenge. This is compounded by the time pressure on intelligence analysts, since timing can be everything when it comes to delivering key intelligence insights.
Graph visualization or network visualization tools offer several advantages for investigation.
- They are no-code;
- They improve efficiency because our brains process visual information much faster than text or numbers;
- These tools facilitate serendipitous discovery.
When you work with connected data, graph visualization and analysis is a decidedly more efficient method than the traditional analysis of spreadsheets or data stored in relational databases.
Graph analysis also offers a valuable set of methods to extract insights from connected data. Graph algorithms can be used to identify communities, spot highly connected individuals or understand flows of information through a network.
Graph investigation tools, such as Linkurious Enterprise, are an additional asset for intelligence analysts facing the challenges of big data. These tools are designed to enable analysts to uncover insights hidden in complex datasets by leveraging the power of graph databases They also provide more agility than in-house tools or complex proprietary platforms, such as i2 or Palantir.
When it comes to threat detection and investigation, graph investigation tools reduce the complexity and noise induced by the nature and volume of the processed data.
Uncovering intelligence insights with Linkurious Enterprise
In Linkurious Enterprise, a complex data domain with different data sources or multiple entity types becomes a single, comprehensive graph. Analysts can visually investigate vast data collections to surface suspicious patterns and connections. Data filters and customizable visualizations help them focus on what’s important and reduce the noise generated by large amounts of data.
Below, we used OSINT data to showcase some of the visualization and analysis capabilities of Linkurious Enterprise. We did this using a publicly available dataset, the Global Terrorism Database. We modeled part of the data (from 2013 to 2016) into a graph database following a simple graph model.
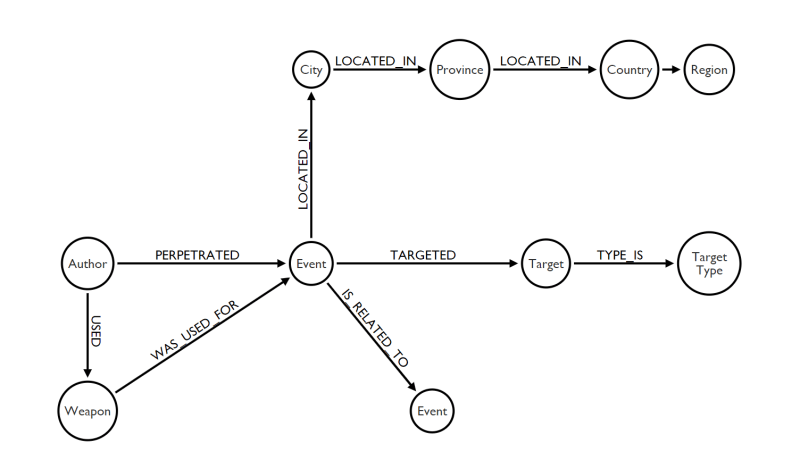
The data was then ingested into a graph database. Our database contains about 90,000 nodes and 240,000 relationships that are now all available for investigation in Linkurious Enterprise.
Investigating intelligence data
Intelligence analysts can use full-text search capacities to look for specific information in the data. In a few clicks, it’s possible to visualize all the terrorist attacks that happened in France between 2013 and 2016. The brown and green nodes respectively present the province of France and their cities. Each blue node represents a terrorist act recorded in a city. When the authors are known, they are symbolized by a yellow node, linked to the events.
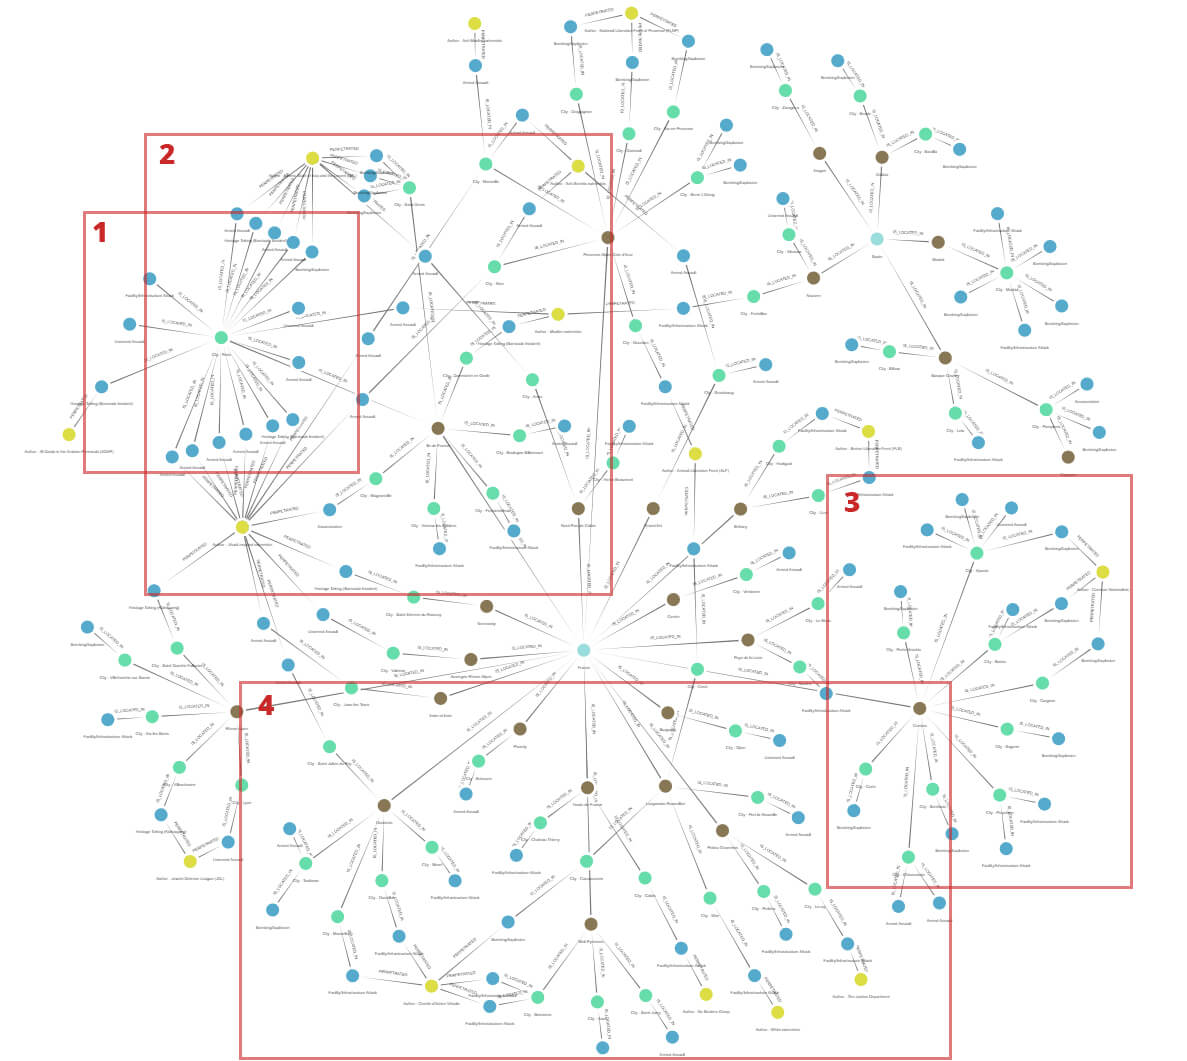
The connections and the different categories of data (events, locations, people) provide contextual information helpful for the analysis, ultimately providing a better understanding of the events. By looking at the node clusters and the relationships, we can identify that:
- Terrorist activities have been important in France;
- Ile-de-France has been a major target for terrorism since 2015;
- The activity of Salafi-jihadist groups (ISIS, ISIL, Al Qaeda, etc.) has been significant, especially in the Paris area;
- The region of Corsica is largely affected by terrorist acts;
- Some specific southern regions are major places of incidents.
From this quickly generated visualization, we are able to identify the main terrorist trends in France (rise of Islamic terrorism, local conflicts, and nationalist movements). In a real-life scenario, professional intelligence analysts can provide accurate reports based on the analysis of conflict and terrorist data.
Geospatial visualization
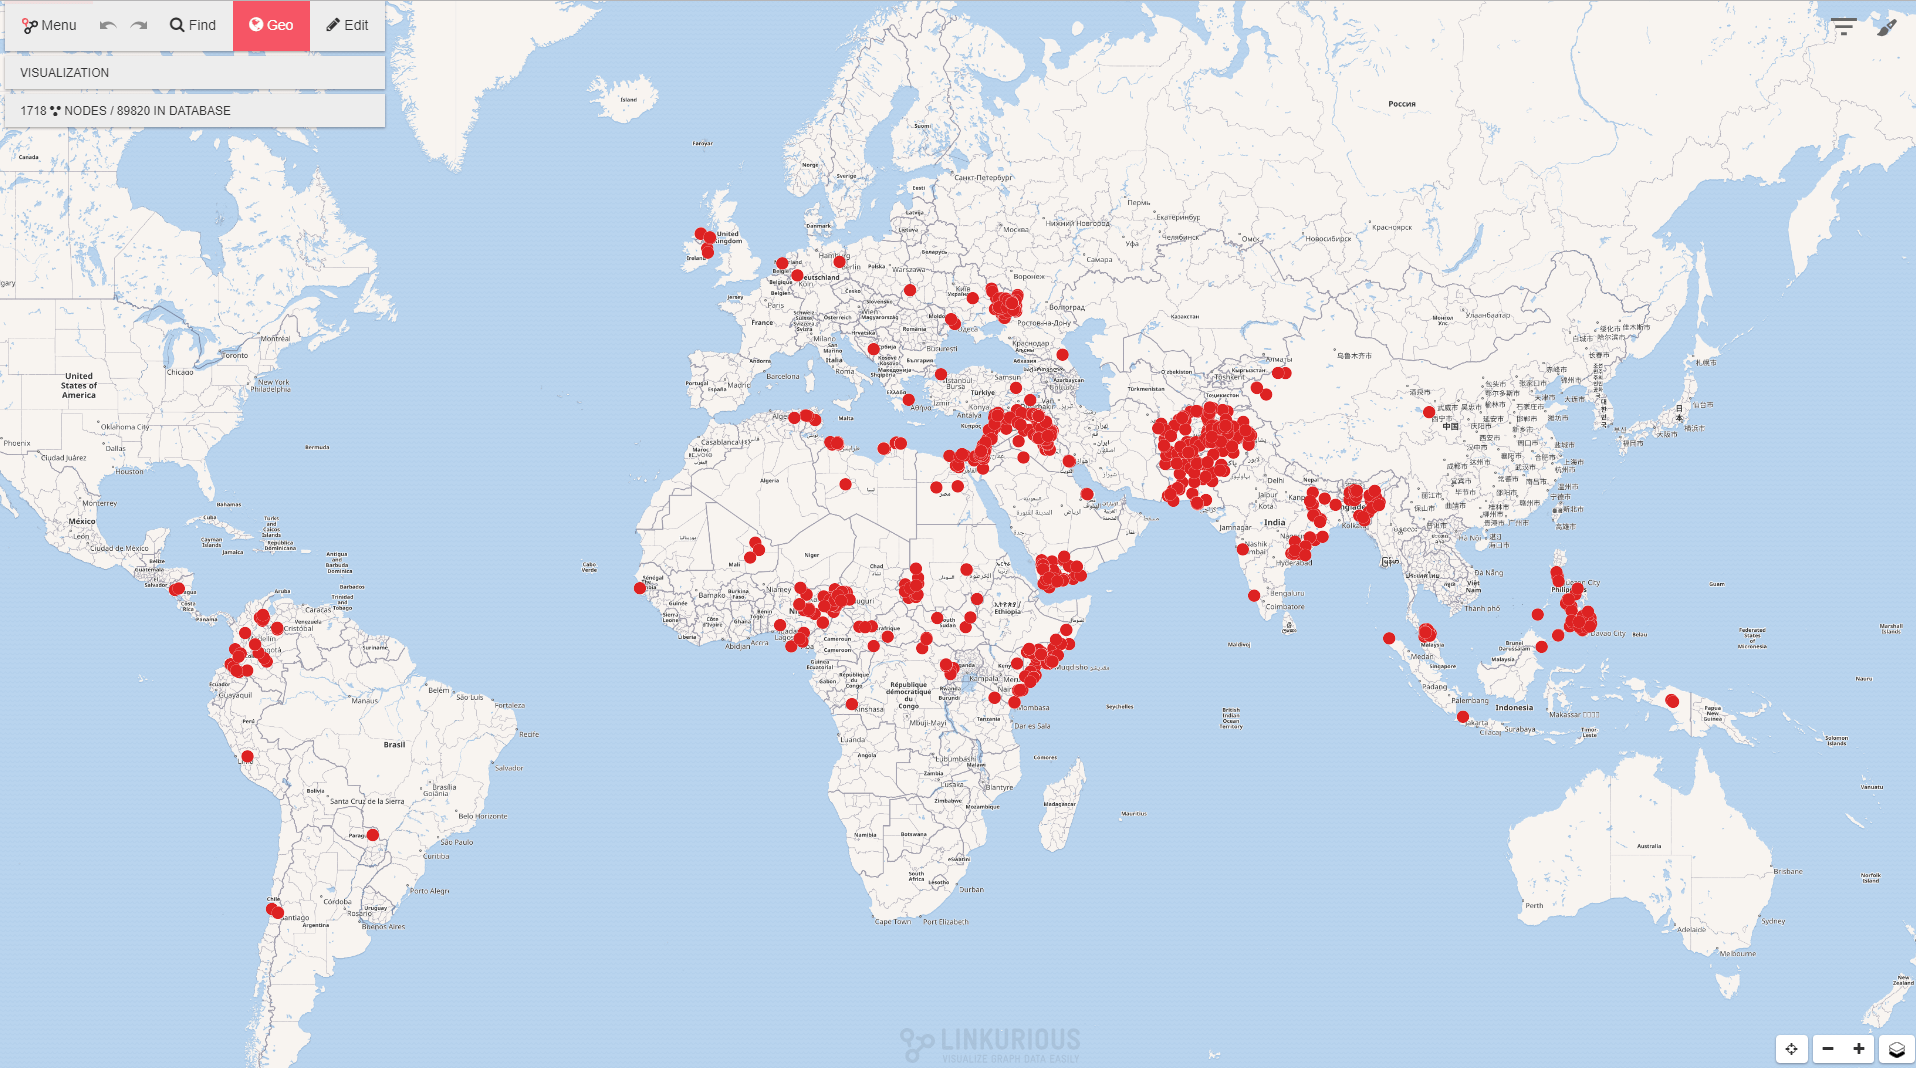
Graph models support the aggregation of heterogeneous data, so it’s possible to enrich OSINT data with geospatial information. In our example, every “Event” node carries geolocation properties, allowing us to display them on a map within Linkurious Enterprise. Below is an example of a geospatial visualization, with events represented as red nodes on the map, which shows a month of terrorist activity.
The advantage of graph databases is that they allow you to quickly traverse a high number of entities and relationships to retrieve information. This stands in contrast with systems based on relational databases in which memory-intensive operations such as querying connections have an exponential cost.
With Linkurious Enterprise, it’s possible to leverage the power of graph databases to search for a specific scenario, such as: “Are these two seemingly unconnected terrorist groups connected, and if so how?” For intelligence analysts, this can help identify key individuals, correlate a series of events with people, or understand the dynamics at work within an organization. Combined with their knowledge and experience, detecting patterns in connected data is an additional asset for intelligence analysis.
Below is an example of a visualization generated with a graph query that matches the world’s ten deadliest attacks since 2013 and their connections to groups, cities, and locations.
Pattern detection
The advantage of graph databases is that they allow you to quickly traverse a high number of entities and relationships to retrieve information. This is a big change from systems based on relational databases in which querying connections are compute and memory-intensive operations that have an exponential cost. With Linkurious Enterprise, it’s possible to leverage the power of graph databases to search for a specific scenario, such as “are these two seemingly unconnected terrorist groups connected, and if so how? ”. For intelligence analysts, this can help identify key individuals, correlate a series of events with people, or understand the dynamics at work within an organization. Combined with their knowledge and experience, detecting pattern in connected data is an additional asset to conduct intelligence analysis.
Below is an example of a visualization generated with a graph query that matches the world’s ten deadliest attacks since 2013 and their connections to groups, city, and locations.

In Linkurious Enterprise, pattern detection can be automated as alerts. It can also detect weak signals in your data that might be part of something larger by combining multiple graph-based detection rules. This reduces the analysts’ workload, with the platform automatically monitoring large volumes of data to uncover hidden connections and complex patterns.
Going further
In our examples, we created our database in a limited time, from a single data source. However, it is possible to add data from additional sources to enrich the database, depending on the questions you want to answer. You could add data from phone interceptions or financial transactions, for instance, to identify potential relationships between attacks.
In addition to the examples we’ve given, intelligence analysts can use advanced graph analysis, a set of methods expressly designed to find insights in connected data. There are many algorithms that can be used to identify communities, to spot people who occupy a key position in a network or to understand how information, money, or people flow through a network.
In the end, graph technology enables intelligence analysts to tackle the changes inherent in the big data era. It’s an asset in the processing, storage, and analysis of the complex data collected today. While graph databases are great to aggregate and connect a multitude of sources in one place, a graph visualization and analytics tool like Linkurious Enterprise helps teams of analysts easily find hidden intelligence within large graphs. It highlights connections in the data, allowing analysts to better understand and analyze complex situations. At the end of the day, analysts can better exploit their data to generate high-value insights.
A spotlight on graph technology directly in your inbox.
