Follow the money: the donors network
The Federal Election Commission is responsible for overseeing election spending in the US. As part of its mandate it collects data and makes it publicly available. We have analysed it to understand the complex economic network behind American politics.
A little context
Political action committee (PAC) play a central role in the funding of American politics. These organization pool campaign contributions from members and donates those funds to campaign for or against candidates, ballot initiatives, or legislation.
The Federal Election Campaign Act (FECA) limits what contributions PACs may accept. For example corporations and unions may not contribute directly to federal PACs. Individuals can contribute up to $5,000 per year to federal PACs. The FECA is supposed to limit the influence of unions and corporations on Federal politics.
Mapping the economic network behind American politics
The FEC provides direct access to campaign finance data. The data provided by the FEC is in csv format. For the 2014-2016 election cycle, it consists of 6 files:
- the Committee Master File: details on the PACs (download);
- the Candidate Master File: detail on the candidates (download);
- the Committees Transactions File: records of all transaction between committees (download);
- the Committees Contributions File: records of all contributions to candidates from PACs (download);
- the Individual Contribution File: records of all contributions by individuals (download);
- Operating Expenditures (download);
The 2014 US elections cost $3.8bn. Candidates, PACs, parties, individuals, companies: the FEC data is available to those curious to understand who funds US politics and how.
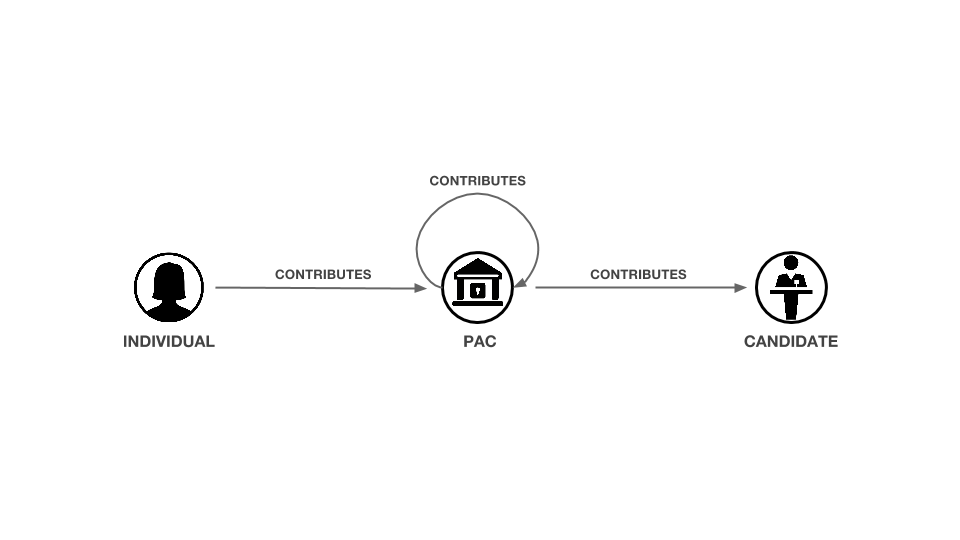
It all starts with individual contributors. They donate money to PACs (Individual Contribution File). The PACs in turn can donate money to political candidates (Committees Contributions File) or other PACs (Committees Transactions File).
This allows us to create a first model of the political graph:
We can complete this picture with additional data from the FEC:
- individual contributors can be linked to companies that employ them (Individual Contribution File);
- candidates can be linked to PACs (Candidate Master File and Committee Master File);
- candidates or PACs can be linked to political parties (via the Candidate Master File and the Committee Master File respectively) ;
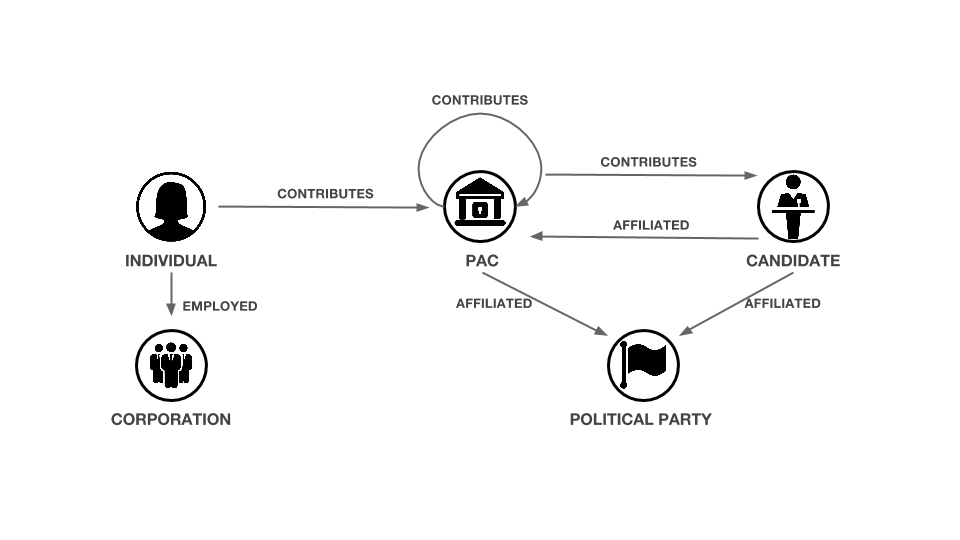
The schema above represents the different entities tracked by the FEC and how they are connected. Equipped with that schema, we can import the FEC files into a Neo4j database. The result is a graph of We have 29 150 nodes and 45 557 edges. You can download it here.
Now we can start asking questions.
Anylising the donors network
In the past, the Washington Post or the Wall Street Journal have studied the PACs network. With tools like Neo4j and Linkurious and the FEC data, anyone can do it. We are going to use Cypher, Neo4j’s query language to extract information from our graph. Let’s start by analysing how much money is contributed to PACs.
//Total individual contributions
MATCH (a:INDIVIDUAL)-[r:HAS_CONTRIBUTED]->(b:COMMITTEE)
RETURN SUM(r.TRANSACTION_AMT) as total
A total of $7 644 141 has been contributed by individuals to various PACs.
Where is this money coming from. We can see which companies employees donate the most money.
//Most generous companies
MATCH (a:COMPANY)<-[:IS_EMPLOYED]-(b:INDIVIDUAL)-[r:HAS_CONTRIBUTED]->(c:COMMITTEE)
RETURN a.EMPLOYER as Company, SUM(r.TRANSACTION_AMT) as total
ORDER BY total DESC
LIMIT 10
Here is the list:
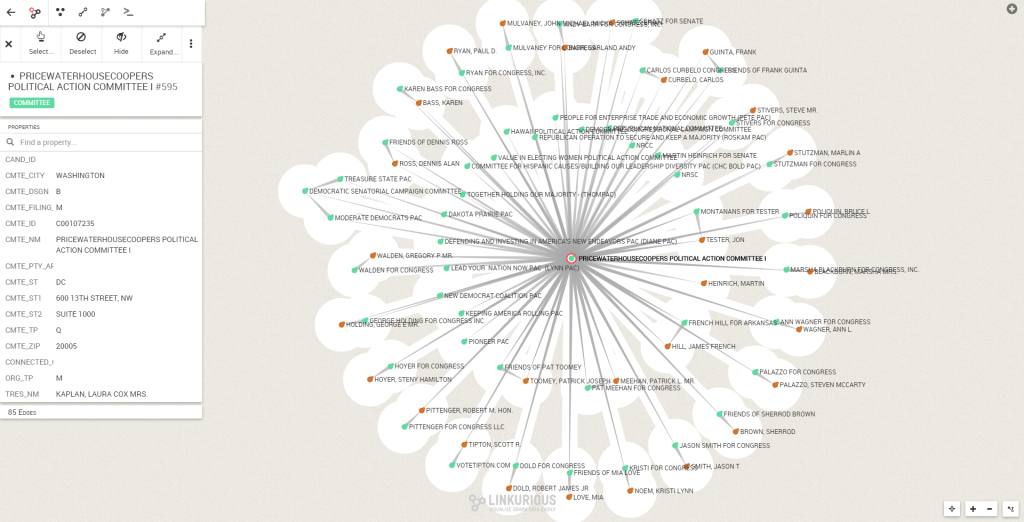
Employees from PWC donated a total of $1 3620 000 to various PACs.
PWC is actually the PAC which collected the most money.
//Richest committtee
MATCH (a:INDIVIDUAL)-[r:HAS_CONTRIBUTED]->(b:COMMITTEE)
RETURN b.CMTE_NM as PAC, SUM(r.TRANSACTION_AMT) as total
ORDER BY total DESC
LIMIT 10
Here is the result:
We can visualize which PACs and candidates the PWC PAC is connected to.
We can see to which candidates the PACs directed the money:
//Who people from PWC donated money to?
MATCH (a:COMPANY)<-[:IS_EMPLOYED]-(b:INDIVIDUAL)-[HAS_CONTRIBUTED]->(c:COMMITTEE)-[r:HAS_CONTRIBUTED]->(d:CANDIDATE)
WHERE a.EMPLOYER=’PWC’
RETURN d.CAND_NAME as Candidate, SUM(r.TRANSACTION_AMT) as total
ORDER BY total DESC
LIMIT 10
Karen Bass, Steny Hamilton Hoyer and James French Hill top the list. The candidate which collected the most contributions though is not among them:
//Richest candidate?
MATCH (a:COMMITTEE)-[r:HAS_CONTRIBUTED]->(b:CANDIDATE)
RETURN b.CAND_NAME as Candidate, SUM(r.TRANSACTION_AMT) as total
ORDER BY total DESC
LIMIT 10
Here is the list of the wealthiest candidates:
John Boehner, current Speaker of the United States House of Representatives, received $146 000 from 34 PACs.
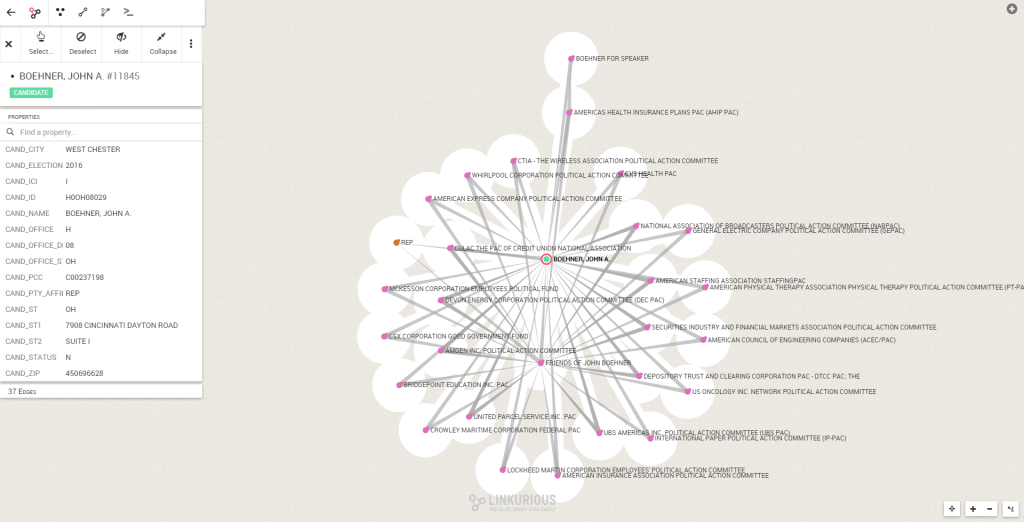
Looking at John Boehner’s network more closely, we can see that a particular PAC plays an important role.
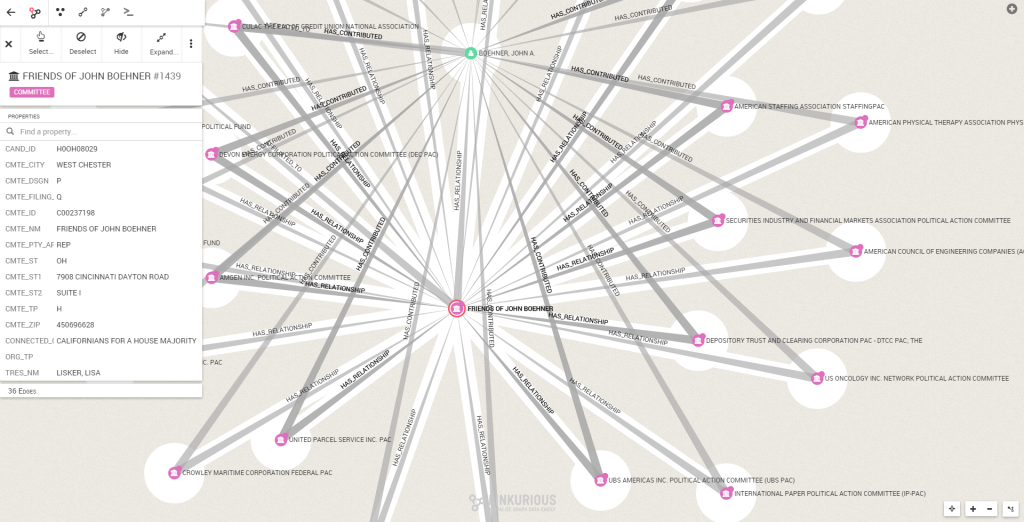
The Friends of John Boehner PAC collects money from 33 of the 34 PACs John Boehner is connected to.
We used a graph approach to model the FEC data. We are able then to analyse the complex network of relationships between parties, candidates, PACs and individual donors. With graph visualization, we can quickly inspect interesting nodes like PWC or John Boehner. Want to know more about US politics? Download the donors graph and explore it!
A spotlight on graph technology directly in your inbox.