The Crunchbase Graph : analysing the graph
The roles of analysis and visualization
We have seen how to model data, how to import it in Neo4j but we haven’t learnt anything about the Crunchbase Graph yet. That’s normal : in all data projects, cleaning up and preparing the data is the most complex part. It is particularly true with graph projects as most data today is stored in relational technologies. Now that we have built a graph and loaded in Neo4j, we can start analyzing the data.
For that task, visualization will be important. In a data analysis project, visualization can be used to :
- build a first understanding and formulate initial insights (exploratory analysis) ;
- validate hypotheses ;
- communicate findings ;
The data we have shows how startups and investors are connected between each other through locations, markets or funding rounds. Let’s start to see what we can learn about the startup ecosystem!
Analysing Crunchbase’s Business Graph
We are going to use Cypher, Neo4j’s query language to analyse the Crunchbase data. With Cypher you can run common SNA algorithms and do custom searches.
Market analysis
Let’s start with something basic. What is the biggest startup scene according to Crunchbase?
//What is the biggest startup scene?
MATCH (a:CITY)<-[:HAS_CITY]-(b:COMPANY)
RETURN a.name as city, count(b) as score
ORDER BY score DESC
LIMIT 5
Simple enough. That query looks up the cities and sorts them by the number of startups that reside there.
That was a simple query. For each city in the graph, we made one step in direction of the startups they are connected to. We can make more complex traversal. It is actually one of the big advantage of graph databases versus relational databases. A query with multiple connections is easier to build and faster to run in a graph database.
We are going to see the markets startups based in San Francisco specialize in. This time we are going to move in the graph from city, to startups, to markets. Here is how to do it :
//What is the market positioning of startups in San Francisco
MATCH (a:CITY {name:’San Francisco’})<-[:HAS_CITY]-(b:COMPANY)
WITH b
MATCH b-[:HAS_MARKET]->(c:MARKET)
RETURN c.name as market, count(c) as score
ORDER BY score DESC
LIMIT 5
And here are the results :
Finding investors
How about a more advanced example? Linkurious is a young French startup and we are interested in fund raising. We’d like to know who are the investors who have made seed funding rounds with startups based in Paris. The answer to that question is also a graph traversal. Let’s see how to translate it in Cypher :
//Investors who like early-stage Paris-based startups
MATCH (a:CITY {name:’Paris’})<-[:HAS_CITY]-(b:COMPANY)-[:HAS_BEEN_FUNDED]->(c:FUNDING_ROUND)<-[:HAS_FUNDED]-(d:INVESTOR)
WITH b, c, d
MATCH c-[:HAS_ROUND_TYPE]->(e:ROUND_TYPE {name:’seed’})
RETURN d.name as potential_investor, count(b) as count
ORDER BY count
DESC LIMIT 5
Here are the results:
We can use visualization to learn more about these investors. First let’s see the French startups our investors have invested in :
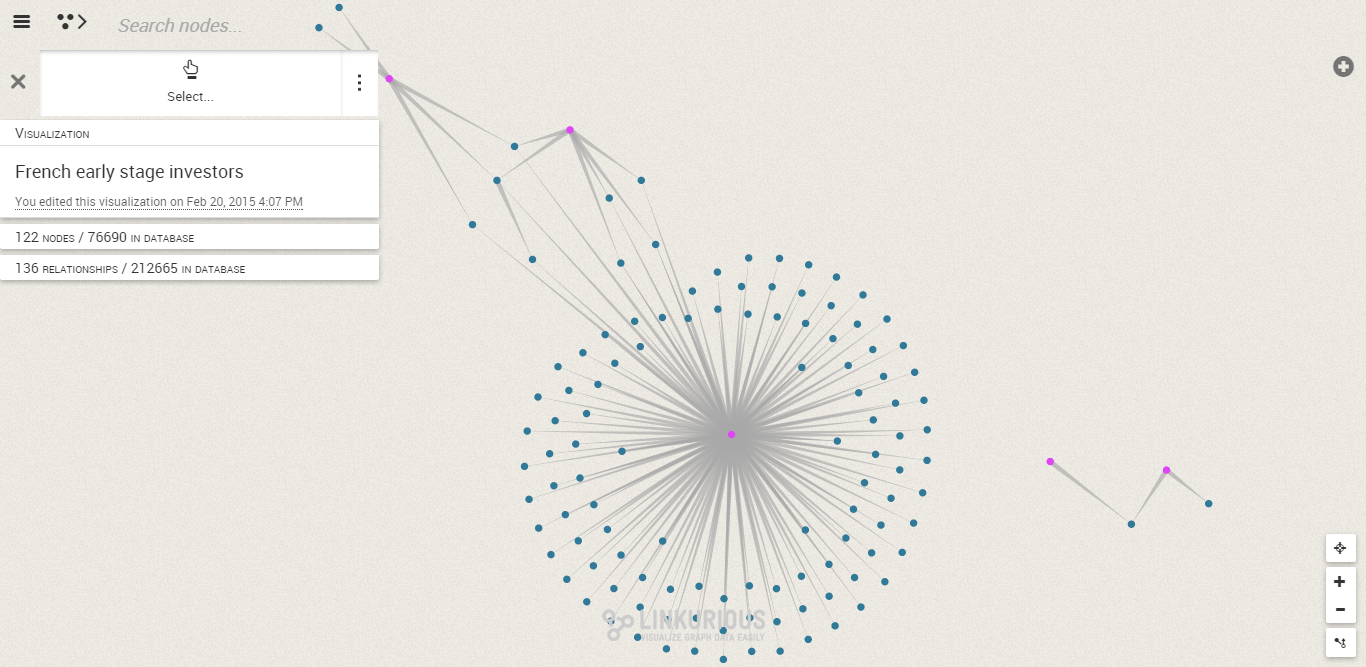
In a single picture we can see that we have two groups and a hyper-active investor.
More details are available by zooming in.
With Linkurious we can continue the exploration of the graph to look at the other companies our investors have invested in.
Making investment recommendations
We can use the Crunchbase Graph for market analysis or for fund-raising. Let’s see how to use it to find investment opportunities.
We could try to identify the investor with the most investments. Maybe that guy can teach us a thing or 2 about investing in startups?
//The investor with the most investments?
MATCH (a:INVESTOR)-[r:HAS_FUNDED]->(b:FUNDING_ROUND)
RETURN a.name as name, count(r) as count
ORDER BY count DESC
LIMIT 5
Here is the list:
That’s a start but maybe we should look for something more “personal”. Neo4j is being used in many dating sites to provide matches. The concept is simple : if you and I “liked” the same 3 girls, I’m probably going to like the other girls that you have liked. The approach is called collaborative filtering and can be used with our Crunchbase data. If you are an investor, you’ll probably “like” the other investments of your co-investors.
Here is how to recommend a few investment opportunities to Sequoia Capital (because these guys clearly need our help) :
//Who should Sequoia Capital co-invest with next?
MATCH (investor)-[:HAS_FUNDED]->(a)<-[:HAS_FUNDED]-(coinvestor)
WHERE investor.name = ‘Sequoia Capital’ AND NOT investor=coinvestor
WITH investor, coinvestor
MATCH (coinvestor)-[:HAS_FUNDED]->(round:FUNDING_ROUND)<-[:HAS_BEEN_FUNDED]-(opportunity:COMPANY)
WHERE NOT (investor)-[:HAS_FUNDED]->(round)
RETURN opportunity.name, count(DISTINCT round) as score
ORDER BY score DESC
LIMIT 5
Here is the result :
Visualization can help us understand what this list of recommendations is based on. Let’s see some of the startups and investors Optimizely and Sequoia Capital are connected to.
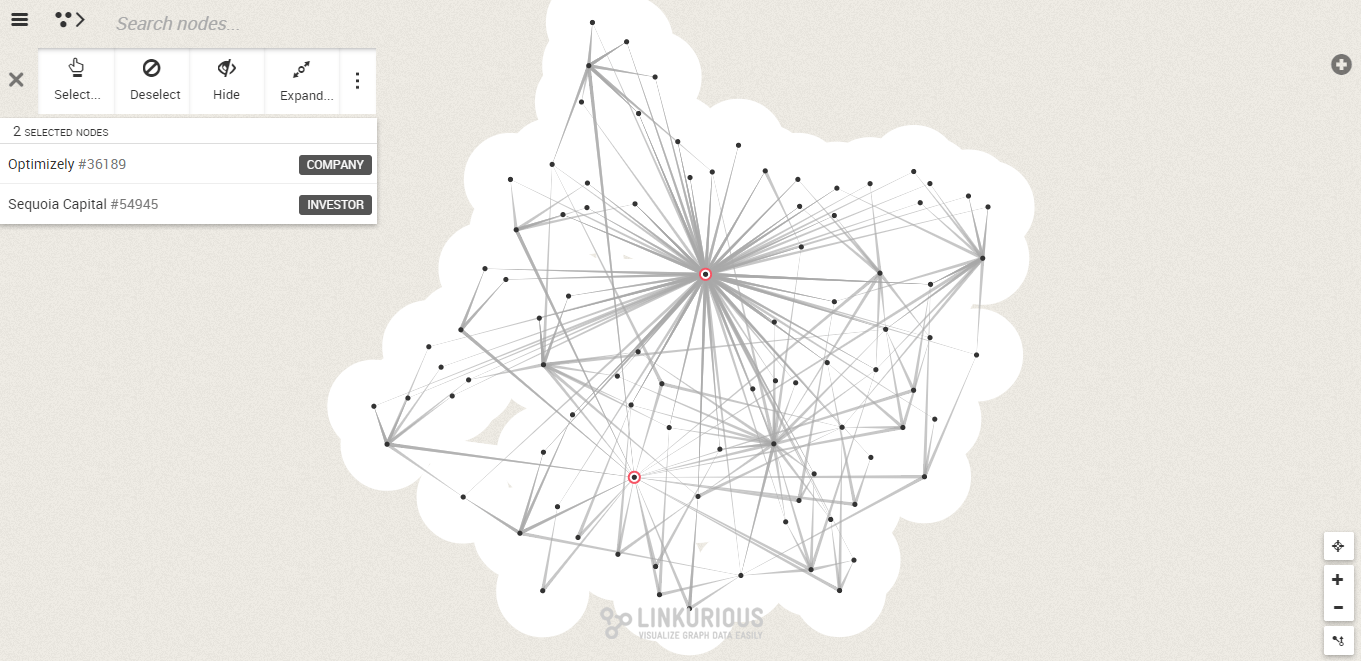
The result for a very dense network. Upon further investigation we can see that the investors of Optimizely have invested in a lot of startups Sequoia Capital has invested in.
We can see for example that Andreesen Horrowitz invested in Optimizely. Andreesen Horrowitz and Sequoia Capital co-invested in a number of companies including Stripe, Jewbone or Instacart.
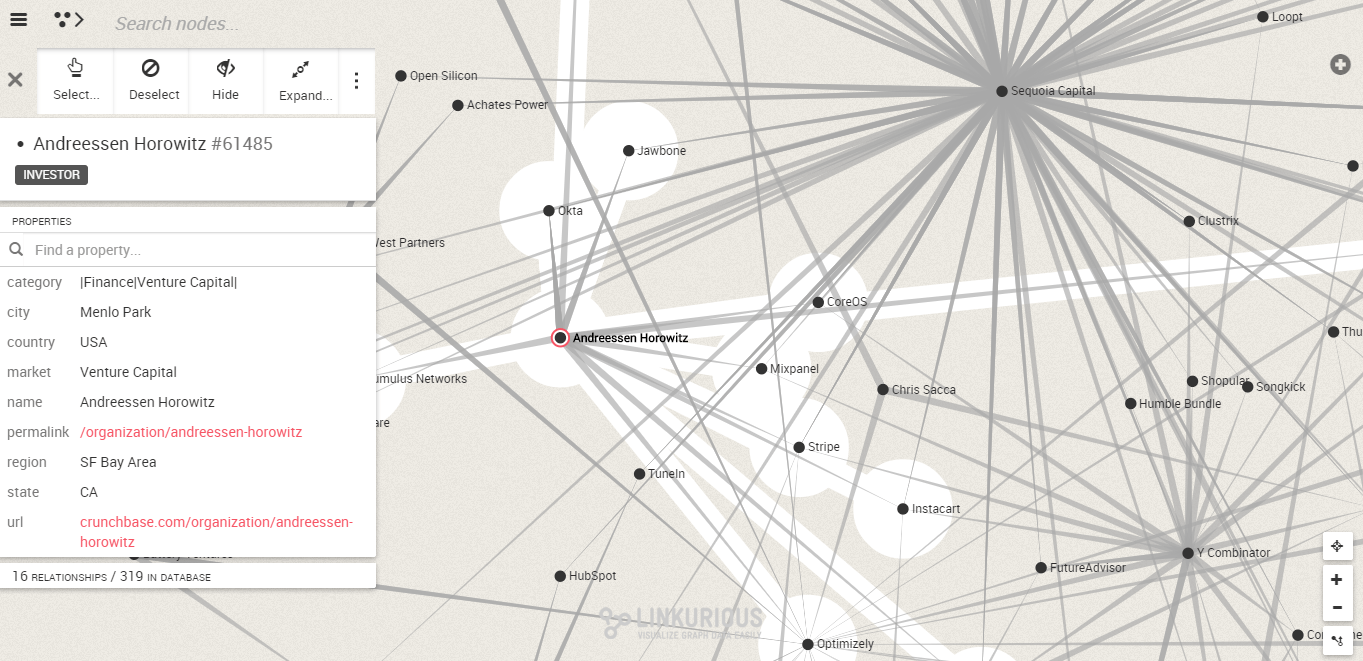
What is interesting here is that we are using the real social connections of Sequoia Capital to make personalized recommendations. I could improve on that recommendation by adding an element of content filtering. After all, maybe Sequoia Capital only cares about the startups based in San-Francisco?
In order to add a content filtering element to our recommendation query, we are going to modify it :
//What SF-based startup should Sequoia Capital invest in next?
MATCH (investor)-[:HAS_FUNDED]->(a)<-[:HAS_FUNDED]-(coinvestor)
WHERE investor.name = ‘Sequoia Capital’ AND NOT investor=coinvestor
WITH investor, coinvestor
MATCH (coinvestor)-[:HAS_FUNDED]->(round:FUNDING_ROUND)<-[:HAS_BEEN_FUNDED]-(opportunity:COMPANY)
WHERE NOT (investor)-[:HAS_FUNDED]->(round) AND (opportunity)-[:HAS_CITY]->(:CITY {name: ‘San Francisco’})
RETURN opportunity.name, count(DISTINCT round) as score
ORDER BY score DESC
LIMIT 5
Here are the suggestions :
That new query combines the social data and the content filtering. We could continue to improve it by adding more and more data. Graphs can be used to make fast and powerful recommendations. To understand these recommendations and evaluate them, visualization is very helpful.
Who is the most influential investor?
We have just seen how to recommend investments opportunities. Let’s try now to find who is the most influential investor in the startup ecosystem. This is a different kind of investigation. We are going to use Social Network Analysis or SNA, a scientific field dedicated to the study of social networks through graph theory. There are a few SNA metrics dedicated to the measure of influence.
Before we can get started we need to run a transformation on our model. We are going to create a direct relationship between the investors who have invested in the same companies. We are going to assume that when someone invests with someone else, he is emitting a social signal : he thinks his co-investors are competent.
Here is how to transform the graph :
//Create relationships between the co-investors
MATCH (investor)-[:HAS_FUNDING_ROUND]->(a)<-[:HAS_FUNDING_ROUND]-(coinvestor)
CREATE (investor)-[:KNOWS]->(coinvestor)
//Remove the rest of the data
MATCH (a)-[r]->()
WHERE NOT a:INVESTOR
DELETE a, r
You can download the resulting dataset here. Now we can get to work. A first of measure of influence is simply to look at the number of connections of each investors. Who is the most connected investor in the startup realm :
//Degree centrality for the Investor’s graph
match n-[r:KNOWS]->m
return n.name as Investor, count(r) as DegreeScore
order by DegreeScore desc
limit 5
We get a list of 5 names : SV Angel, 500 Startups, First Round, New Enterprise Associates and Kleiner Perkins Caufield & Byers.
We could have used a more sophisticated measure of influence like betweenness centrality. According to Wikipedia, “betweenness centrality is an indicator of a node’s centrality in a network. It is equal to the number of shortest paths from all vertices to all others that pass through that node”. Here is how to calculate it :
//Betweeness centrality for the Investor’s graph
MATCH p=allShortestPaths((source:INVESTOR)-[*]-(target:INVESTOR))
WHERE id(source) < id(target) and length(p) > 1
UNWIND nodes(p)[1..-1] as n
RETURN n.name as Investor, count(*) as betweenness
Limit 5
Let’s take a look at the network of SV Angel, our most influential investor.
Through that series of article on Crunchbase we have shown the typical parts of a graph project. We started with data that was not in a graph format. First we modeled it. Then we loaded it in a Neo4j graph database. Finally we were able to analyse the result. By combining graph analytics and visualization, we discovered market trends, how to make investment suggestions and how to identify influential investors. We hope it will inspire you to look at the graph in your own data soon!
A spotlight on graph technology directly in your inbox.