Charting a course for graph project success: Key steps and best practices
Graph is a powerful technology that has been transforming the way organizations across industries are able to analyze and gather insights from their data. By structuring your data as a network of interconnected nodes and relationships, a graph data structure enables you to break down data silos to quickly gain a deep understanding of the connections within your data.
Like any new technology you might want to add to your stack, getting started with graph can be both challenging and frustrating if you don’t follow the right steps and adopt best practices to give your graph project the best chance to bring value to you and your organization. With that in mind, this blog post is here to help you out! Our graph experts here at Linkurious have laid out the essential steps to succeed with your graph project. From setting goals to modeling your data to onboarding users, this article walks you through what you need to know to succeed with your graph project.
Develop your own graph application or use an off-the-shelf product?
When you’re looking to launch your graph project, there are two main options to consider first. You can develop your own graph application using a graph visualization library such as Ogma, or you can use an off-the-shelf product. Developing your own application offers the highest degree of flexibility, which can be an important consideration for certain organizations and for certain projects. This type of solution requires a lot of technical expertise and development resources, however. As such, it’s not the most suitable solution for everyone.
With an off-the-shelf graph solution, while still requiring some technical know-how, you can get up and running with more ease. The product features are available out of the box, so you don’t need to spend time developing them yourself.
For the purposes of this article, we’re going to look at the process of running a graph project with an off-the-shelf solution, like our own Linkurious Enterprise.
Step 1: Sorting out the prerequisites for your graph project
This first step might be the most important. Think through your prerequisites: decide what your goals are, what the configuration of your team will be, and what your technical requirements are. Carefully considering your goals and needs are essential to making sure your project runs smoothly.
Remember that graph is a relatively new technology, full of potential to deliver previously unseen insights from your data. “It’s helpful to avoid thinking about it as a direct replacement for your existing tools, or trying to replicate the user experience of something else,” says Andrea Fantaccione, Head of Solutions Engineers at Linkurious. “By trying to understand the potential of graph technology, you stand to maximize your benefits from it.”
There are also various resources you can tap into as you set up the prerequisites for your graph project - and throughout the rest of the process. Vendors can help you evaluate their product for your specific use case, to be sure their product is a good fit. There are also paid services available, both through the vendors themselves and through consultants. Finally, most vendors (including Linkurious) offer post-sales customer service in their licenses to help ensure your success with their products.
Establishing your goals and decide on KPIs
When you first start out, you should have a clear understanding of your goals for your graph project to help guide you in the process. Here are some questions to ask yourself:
- What are you trying to achieve?
- What problems are you currently facing?
- How are you handling those challenges now?
- What is the impact of your current challenges?
Once you have some goals in mind, consider how you will measure your project’s success. Establishing KPIs from the outset will help you determine later on if your project has achieved its goals.
Create your graph project dream team
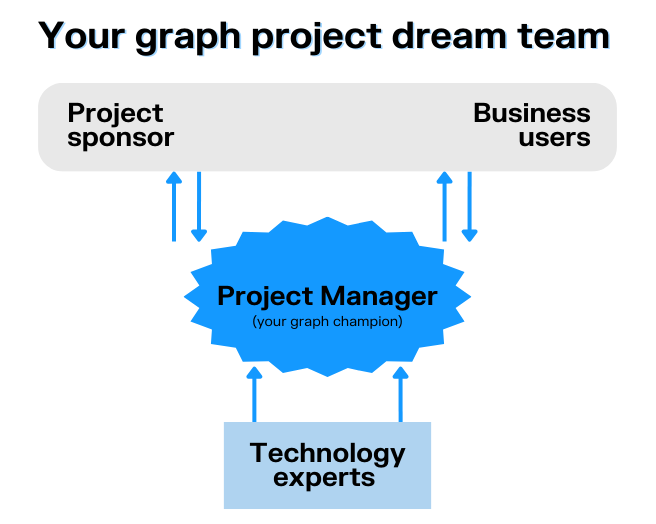
Involving the right people in your project will help it run smoothly. There are a few different roles to fill when you’re kicking off a graph project.
- Project sponsor: They will ensure access to the required resources and validate the evaluation’s outcome. This is also the person defining the project’s objectives.
- Project manager: This person is your graph project champion. They will coordinate the project and make sure the evaluation is focused on tangible business outcomes.
- Technology expert: This person can deploy the relevant infrastructure, has access to the data sources, and can install the graph database and other graph tools. They should be familiar with a graph query language.
- End users: The end users are the ones who will actually be taking advantage of the whole graph solution. These are the individuals who will actually test using the graph tools and provide feedback regarding the real business impact of the solution. Depending on the use case, these may be fraud analysts, risk managers, supply chain analysts, etc.
One person may hold a couple of different roles. Keep in mind that you can also decide to rely on some external resources through graph technology providers like Linkurious Enterprise or consultants. This can be a good solution if your team does not already have graph technical expertise.
Finally, it’s important to make sure all key stakeholders are on board. Having buy-in from both business users and technical users will reduce roadblocks as you make progress on your project. When teams are able to work collaboratively, it greatly facilitates the graph project process.
Identify your technical and data requirements
The last of the preliminary steps is to look into your technical and data requirements. Here is a list of questions to consider:
- What is the data you want to analyze?
- Do you have access to a server?
- Do you already have a graph database?
- Do you have specific security requirements for your project?
- Will you need any third-party integrations?
One thing to keep in mind is that for both Linkurious Enterprise and the graph database of your choosing, you can opt to use SaaS. This can translate to a zero-cost evaluation for setting up your graph project.
Finally, a word of caution on the technical side of things: “We’ve seen teams spend a disproportionate amount of time on the technical and security aspects of their projects,” says Andrea Fantaccione. “Spending more time focusing on the technical parts rather than graph features and end goals can translate to slowed progress, a lack of end-user involvement, and a tool that doesn’t end up being used. Ultimately, your project should be business-driven rather than IT-driven.”
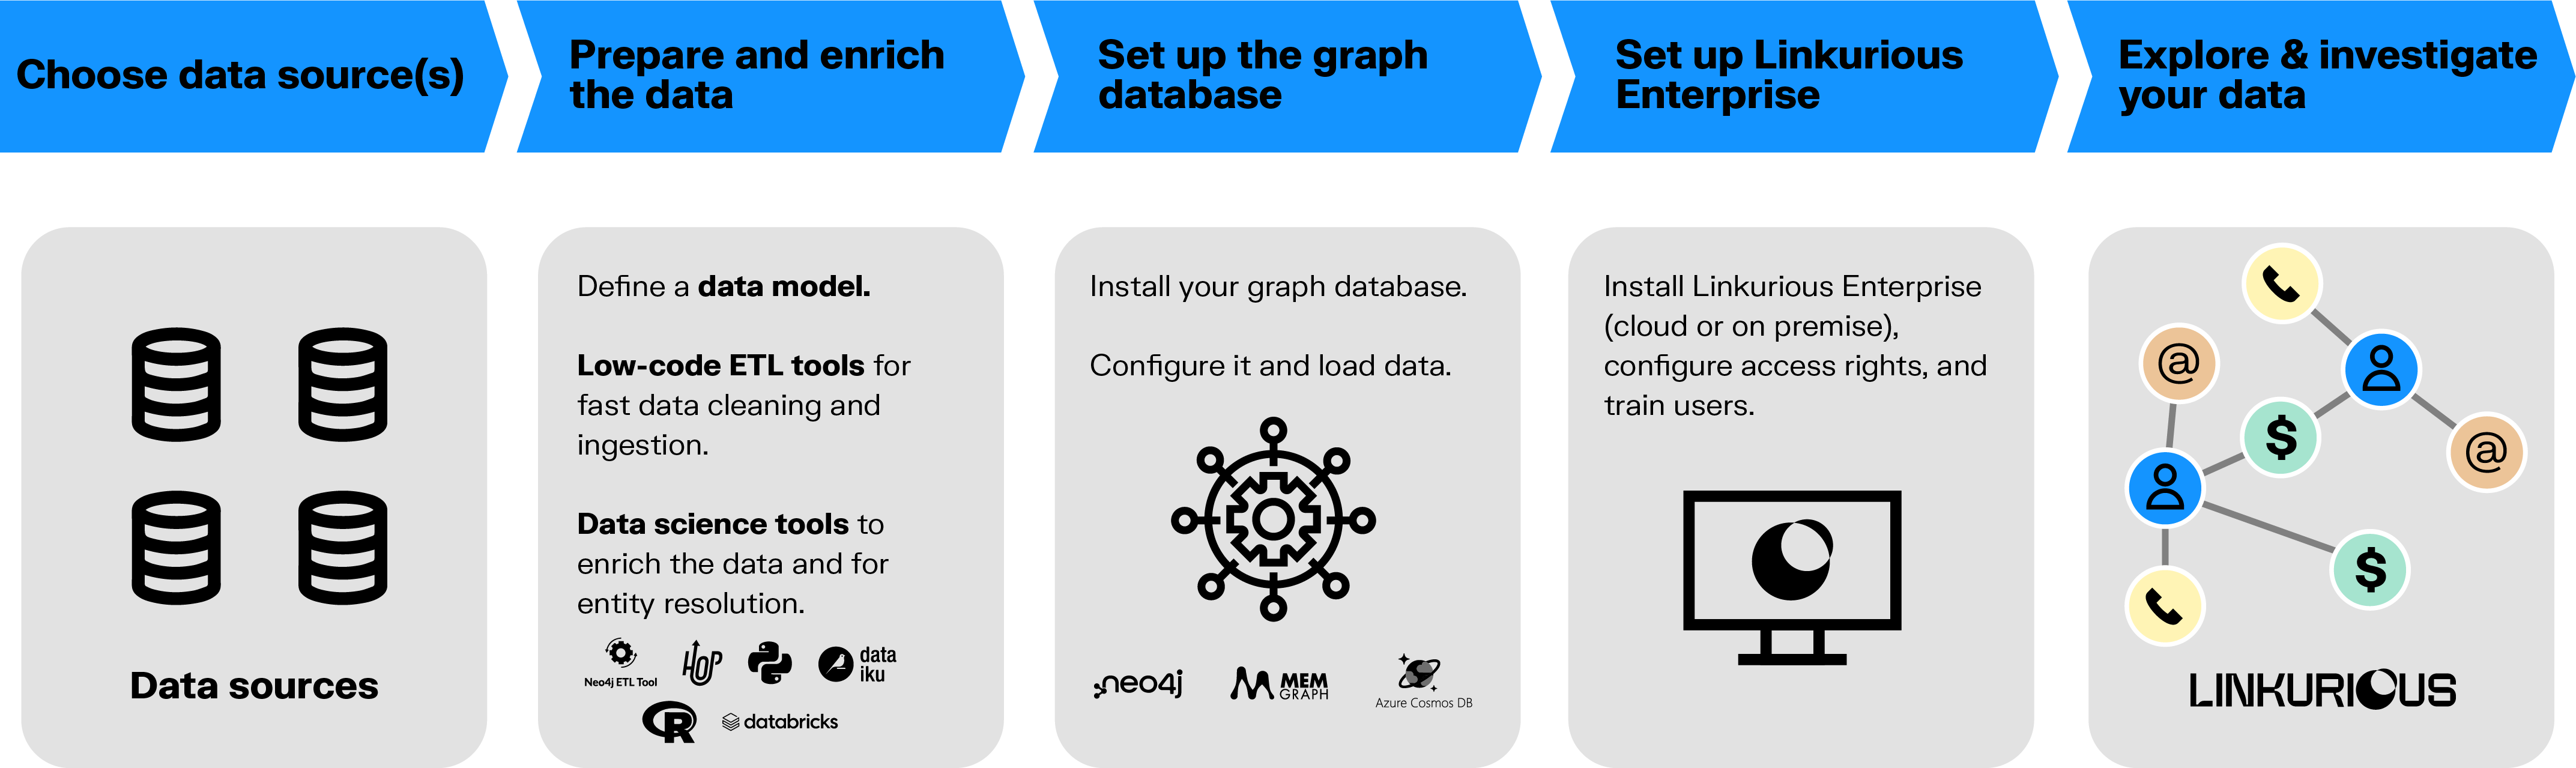
Step 2: Setting up your architecture and modeling your data
Setting up your tech architecture and modeling your data is primarily a job for the technical team (see our team breakdown above). There are a few different steps to take into consideration for your technical set-up.
- Determine your hardware requirements. Will you opt for server delivery or cloud infrastructure delivery?
- Determine your graph data model. The model you choose will depend on your data sources and business requirements. This is the step where you’ll determine what in your dataset(s) will be nodes, edges, and properties. Modeling your data in this way is necessary to uncover hidden relationships, complex patterns, and to understand the context surrounding any entity within your data. (Learn more about graph data modeling here.)
- Decide what graph database you will use.
- Define your indexation strategy and choose your indexation solution accordingly.
- Finally, you’ll need to extract your data.
A word of advice: it’s better to err on the side of starting small with your data. “Working with a large dataset can be tempting to maximize the kind of insights you can get from your data,” says Andrea Fantaccione, “but it can be overwhelming if you’re new to graph. Starting small will help ensure your project stays manageable, and you can always scale up and add more data later.”
Step 3: Installation and configuration
The next step is to install and configure your graph tools. The first thing to do here is to install and configure your graph database. There are more and more database options on the graph technology market, and Linkurious works with several of them. If you don’t already have a graph database, you can evaluate with the vendors which option best meets your needs. Then, you can import your data. We provide some information on importing data by database in our documentation.
After that, you can set up your graph visualization and analytics tool. If you’re using Linkurious Enterprise, this can be done in a few steps:
- First, give Linkurious Enterprise access to your graph database.
- Next, set up indexing.
- Then, you can configure users, groups, and access rights. Linkurious Enterprise offers advanced and easy to use user management, making it an ideal solution for teams that are larger and/or that have multiple user roles: administrators, analysts, alert reviewers, etc.
- Define your data schema.
- Finally, you can set up your default styles. In Linkurious Enterprise you can customize colors, icons, and captions, enabling you to create a unique visual language to help your team easily understand their graph visualizations at a glance.
It’s a best practice to set up a review session once you’ve made it through the setup, installation, and configuration phases. This will give you an opportunity to see if the solution is working according to your expectations.
Step 4: Setting your team up for success
Once you’ve set up and configured your graph tools, the next step is to onboard your team and make sure they have the knowledge and skills they need to succeed. This may include learning a graph query language like Gremlin or Cypher. You can also hold training sessions for administrators and for end-users to ensure they are at ease and able to get the full benefits from your graph tool.
Training and support from your vendor for both administrators and end-users will help ensure they are at ease and able to get the full benefits from your graph tool. When choosing a vendor, the breadth of support they can provide - in-person training, self-service training, professional services, etc. - should be taken into consideration. In addition to options for professional services and in-person training, Linkurious, for example, comes with free access to Linkurious Academy. This on-demand online educational platform offers a range of courses to help every type of user get up to speed and facilitate further development of more advanced skills.

Step 5: Assess the business value of your graph project
The final step of your graph project is to assess its value. This isn’t a one-and-done task. Rather it should be done progressively, in several phases.
- Start by running some initial tests. The project manager and/or a couple of end users can start using Linkurious Enterprise to start validating the requirements and identifying potential issues.
- Next, make adjustments as necessary. There are many different elements you can modify to better meet your goals. Maybe there are some other data sources you should integrate in order to achieve your objectives. Maybe the data should be modeled differently to be more comprehensible. Maybe the server and software need to be adjusted to address performance issues. Or maybe the Linkurious Enterprise configuration should be tuned differently to better meet your business needs. You can try adjusting these things and re-test to see if the changes have an impact.
- Set up some advanced features. Once you’re happy with your initial setup, you can try out some of the more advanced features of Linkurious Enterprise. You could automate some investigation workflows using alerts or query templates. Maybe it makes sense to adjust access rights and security. Or maybe you need to integrate graph capabilities within other applications.
- Do a final testing. With users fully trained and onboarded and the solution in place, you can do a final round of testing.
- Finally, you can assess user adoption and collect user feedback on your graph project to understand if it has met your initial goals.
- And, as a bonus step: Move back to steps 2 and 3. A graph project should evolve over time to meet your organization’s shifting needs. As your own needs change, or as Linkurious Enterprise rolls out new features, you should adjust your graph project accordingly to make sure you continue to get value from it.
Ready to get started?
Now that we’ve been through the essential steps and best practices of a graph project, maybe you’re feeling ready to get started on your own. We’re happy to help you get your project off the ground: our solution engineers can be by your side to help you from A to Z. Contact us to learn more about our products, solutions, and services.
A spotlight on graph technology directly in your inbox.