Data is a goldmine for all kinds of businesses and organizations. It’s an essential tool for decision making, streamlining various processes, and optimizing business performance.
Graph technology is an emerging branch of data analytics that empowers many types of organizations to gain a deeper understanding of their data. Graph analytics can help tell the full story behind your data, delivering powerful insights to make better decisions.
Graph analytics can tell you everything from who is the central player in an organized crime group, to how to optimize shipping routes, to how a change in your IT systems might create a ripple effect.
This article introduces graph analytics - or link analysis - and graph databases, the graph algorithms behind it, what the advantages of using graph analytics and network visualization are, and more. We’ll also explore some common graph analytics use cases to see how graph can be applied.
What is graph analytics?
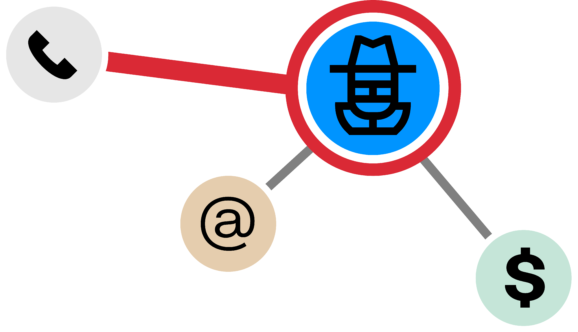
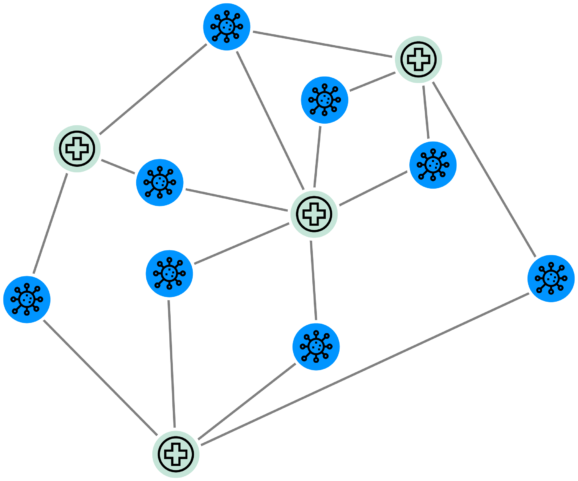
First, a quick summary of the basics of the concept of graph. A graph data model consists of nodes and edges. Each node represents an entity, such as a person, a bank account, an address, or any piece of data. Each edge represents how two nodes are linked to each other: for example, person “a” owns bank account “b”. Nodes and edges can have properties - additional information associated with them. For instance, the name of the person “a” is “John”.
Examples of data that can be represented as a graph include social networks, supply chains, financial transactions or protein interactions.
When you’re working with large datasets or multiple data sources, the relationships within the data can be highly complex. By analyzing data as a graph, it’s possible to determine the closeness of different entities, as well as how entities are connected. Graph analytics provides algorithms that help data scientists and data-driven analysts answer questions or make predictions using graph data.
By comparison, traditional analytics based on relational databases are more focused on individual data points, either considered separately or aggregated.
Graph analytics has many uses, including for supply chain management, anti-fraud, anti money laundering, IT management, social networks, and more.
Graph analytics is closely related to other types of analytics that deal with networked or connected data, such as network analysis or link analysis.
Graph databases and graph analytics
Graph databases emerged to address some of the shortcomings of the relational database management systems (RDBMS) that emerged in the 1980s. These relational databases are well suited for use cases involving data which is consistent and not highly connected. They are very good for routine analysis of data, or fast operations at scale such as verifying that a transaction belongs to a valid customer.
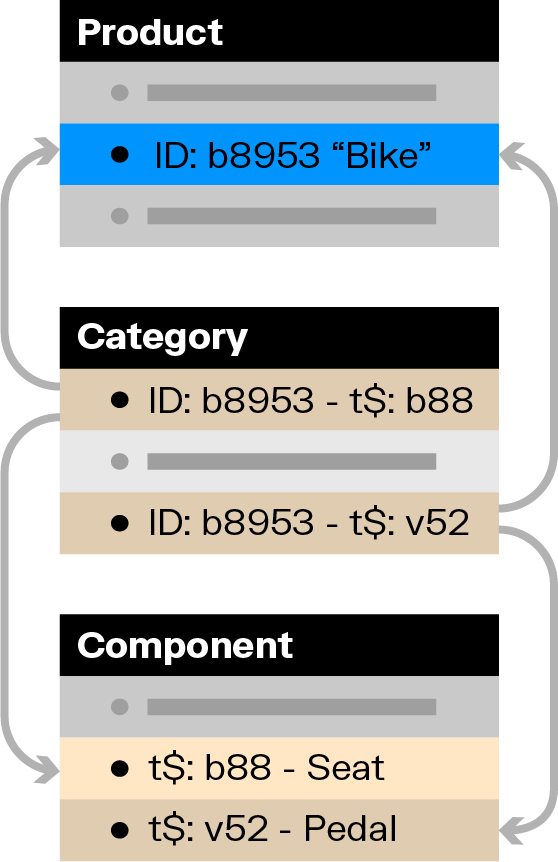
RDBMS come with some drawbacks, however. First, they have poor performances for queries involving the traversal of multiple relationships. Retrieving the relationships of a row requires going from table to table via “joins”. These joins have an exponential computational cost. As a result, queries that require going through a high number of joins are oftentimes impractical for performance reasons.
They are also rigid. Tables are hard to evolve and relationships across tables are complex to manage. As a result, RDBMS tend to struggle to adapt to domains with complex connected data.
Graph databases, on the other hand, are optimized for the storage and analysis of large graphs. They contain nodes, edges, and properties, and are equipped to represent information in a way RDBMS aren’t able to.
A graph data model makes it intuitive to represent all the relationships in a data domain. It’s also easy to adapt as the need for new entities and new relationships emerge. Finally, graph databases are also optimized for graph analytics workloads which require the traversal of many relationships.
Examples of graph algorithms
Graph algorithms are the tools that let you analyze your data to make predictions or find the answers you need. There are multiple algorithms available in the graph data science toolbox. Here are the main categories of graph algorithms.
Path analysis
Path analysis algorithms help find the shortest path between a set of nodes. They can be used to optimize a supply chain, find the shortest shipping route, or the quickest line of communication.
Examples of path analysis algorithms include A*, Minimum Weight Spanning Tree, and All Pairs Shortest Path.
Centrality analysis
Centrality analysis algorithms help assess the importance of a set of nodes within a graph. It can be used to identify someone influential within a social network, or where the gatekeepers lie in a particular group.
Examples of centrality analysis algorithms include PageRank, Eigenvector Centrality, Betweenness Centrality, and Degree Centrality.
Community analysis
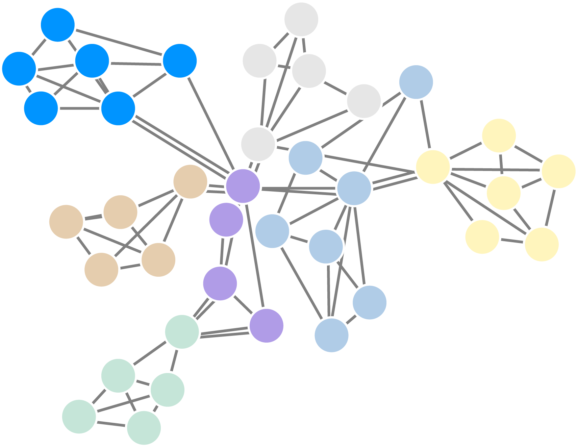
Community analysis algorithms help identify nodes sharing similar characteristics. It can be used to identify a community of persons based on phone calls or emails, for example. Understanding these groupings can let you know exactly how they are connected and how they influence the larger network.
Examples of community analysis algorithms include Louvain algorithm, Label Propagation, and Weakly Connected Components.
Similarity analysis
Similarity analysis algorithms help identify similar nodes. It can be used to identify whether two nodes are likely to be referring to the same entity.
Examples of similarity analysis algorithms include K-Nearest Neighbors, Jaccard Similarity, and Cosine Similarity.
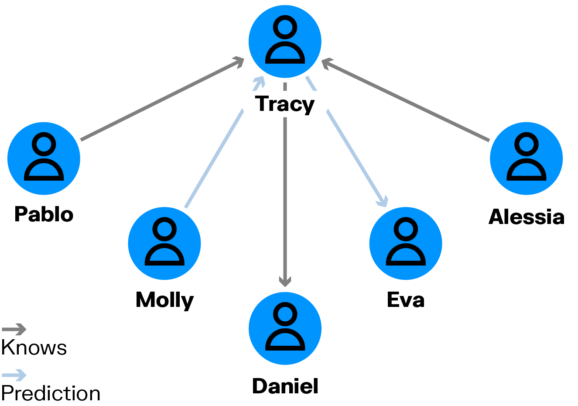
Link prediction
Link prediction algorithms help predict new links between pairs of nodes. It can be used to predict how likely two persons are to know each other based on their relationships with other persons.
Node embeddings
Node Embedding algorithms compute vector representations of nodes in a graph. It can be used to leverage graph data in machine learning models. (Learn more about graph machine learning here.)
Examples of this are GraphSAGE and Node2Vec.
Graph analytics use cases
Graph data is everywhere, so the potential to apply graph analytics is considerable. Any business with a significant amount of connected data can benefit from using graph analytics.
Here are some concrete examples of common graph analytics use cases.
Fraud and money laundering
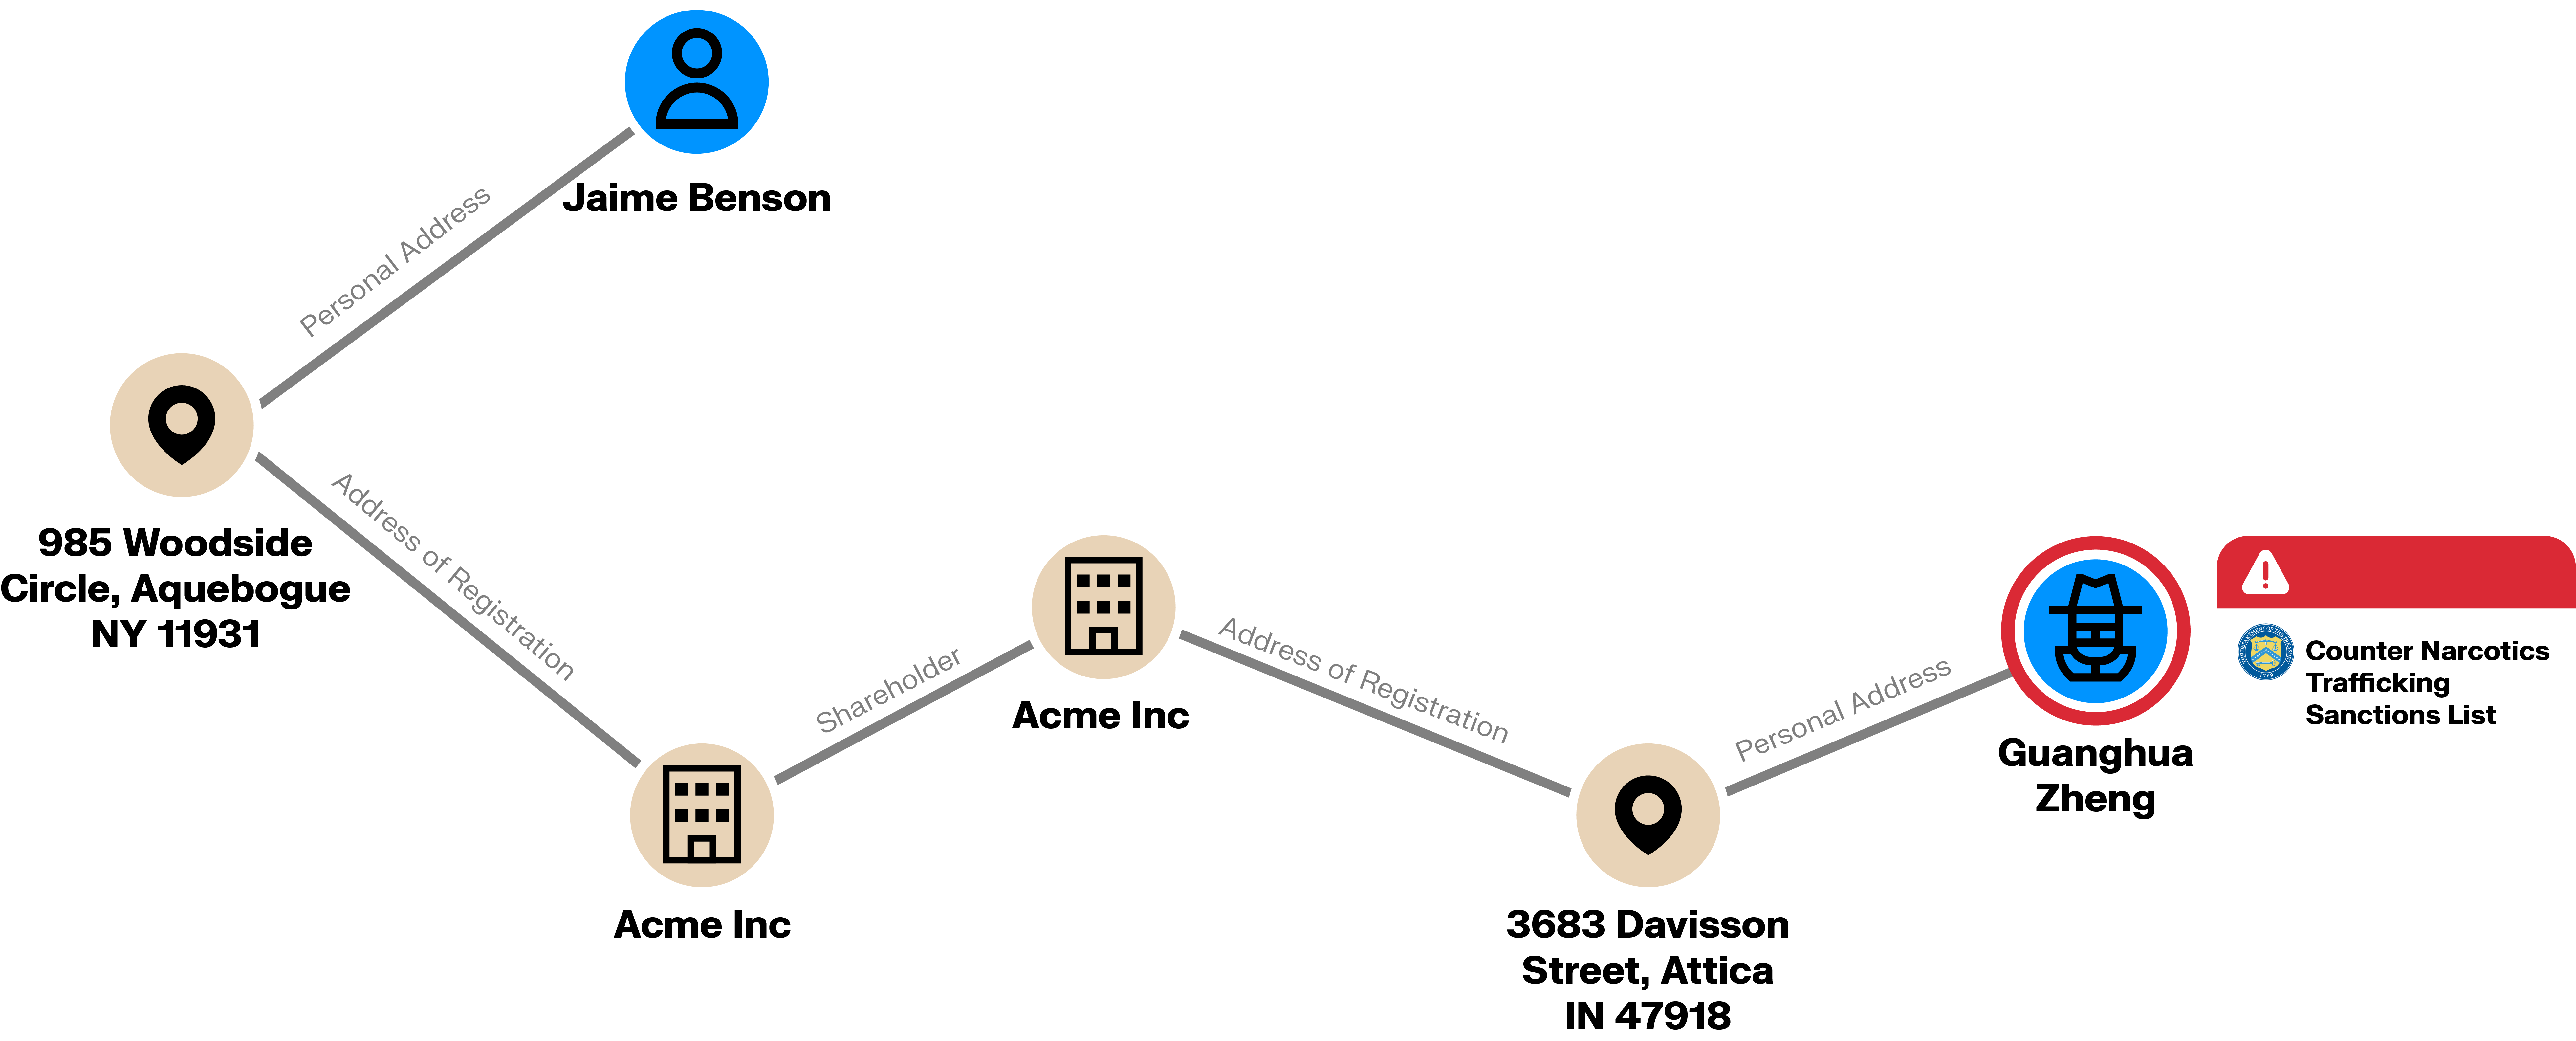
Banks and other financial institutions must constantly monitor customer behavior and transactions for fraud and other financial crime activity. Graph analytics can be used to peer into multiple data sources such as customer data, sanctions lists, external databases, etc. to quickly detect criminal rings, suspicious money transfers or relationships between seemingly normal clients and criminals.
Supply chain
When working with complex supply chain and shipping operations that may span several countries, you need to have a clear view of your data and operations. Graph analytics can be used to optimize the delivery of parcels, assess the robustness of a supply chain, or understand the impact of a failure within a supply chain.
IT and data governance
The field of IT operations management keeps growing with our increasing reliance on computer systems, networks and the growth of the Internet of Things. As IT systems increase in complexity, graph analytics can be used to understand the ripple effects of a change within an IT network, identify the root cause of an IT outage, or track data lineage.
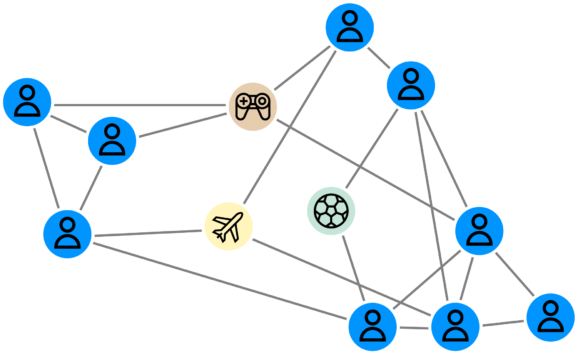
Social networks
Many of the applications we use every day, like LinkedIn or Facebook, rely on networks and connections. Graph analytics can be used to suggest potential friends and interests, or identify communities or people with influence.
Medical research
Graph technology has many applications in medicine. Graph analytics can be used to understand the interactions between proteins, to track the spread of disease, or identify the most influential authors on a given medical topic.
What are the advantages of using graph analytics?
Many of the use cases outlined above can be addressed without graph analytics. For example, machine learning can be used to detect suspicious transactions or to make suggestions about who to add as a friend on a social network.
Why use graph analytics then?
Let’s consider a money laundering scenario:
- A traditional business rule related to whether a client is sending money to a country with a high risk score can help identify a risky transaction.
- A machine learning model can help identify that this same transaction is similar to a transaction that’s been flagged as suspicious in the past based on dozens of data points such as a time, amount, location, etc.
What if the criminal is prudent enough to send the money in a way that’s consistent with other normal transactions and send it to an intermediary party instead of sending it directly to a risky country? A graph analytics approach can leverage the context of this transaction to spot that something risky is going on. Graph analytics does this by:
- Looking at the indirect connections of the money’s recipient and identifying ties to risky companies and individuals.
- Looking at the patterns of money transfers in the client’s bank account to identify if the outbound flow of money is preceded by a similar inflow of money. This could be indicating that the client is acting as an intermediary and is thus risky.
Graph analytics do not replace other analytical approaches. It’s a complementary approach that leverages the context of clients, locations, events, or objects to surface insights that would otherwise be missed.
Top graph analytics platforms
There are multiple tools to do graph data science, such as graph databases (designed to store and query in real time graph data using graph query languages), graph libraries (designed to provide an easy access to popular graph algorithms) or graph processing frameworks (designed to apply graph algorithms to big data graphs). Here are some notable solutions:
- Neo4j is the most popular graph database on the market. It is compatible with the Neo4j Graph Data Science Library, a dedicated graph analytics framework.
- CosmosDB is Microsoft’s cloud graph database.
- Spark is an analytics engine. It includes GraphX which is a dedicated API for graphs and graph-parallel computation.
- RedisGraph is the graph database module of the popular Redis database.
- Memgraph is an in-memory first graph database. It is compatible with MAGE, a dedicated graph analytics framework.
- TigerGraph is another graph database. It also includes a Graph Data Science Library dedicated graph analytics framework.
- JanusGraph is an open source graph database with a distributed architecture.
- Amazon Neptune is a graph database service from AWS.
What is graph visualization?
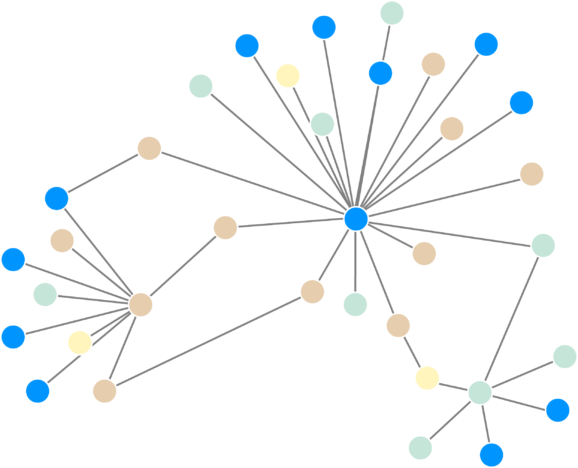
Graph visualization is the visual representation of data stored as a graph. Nodes and edges are displayed as a visualization. Algorithms called layouts determine the position of the nodes and edges in two or even three dimensions.
Graph visualization provides an intuitive way to understand and explore graph data. The human brain processes visual information much more quickly than written information. Visualizations can make it faster and easier to detect patterns or understand information within a graph. It also makes it easier to share insights and findings with stakeholders.
Graph visualization also makes graph analytics more accessible, since non-technical users can interact with graph visualizations even without programming skills.
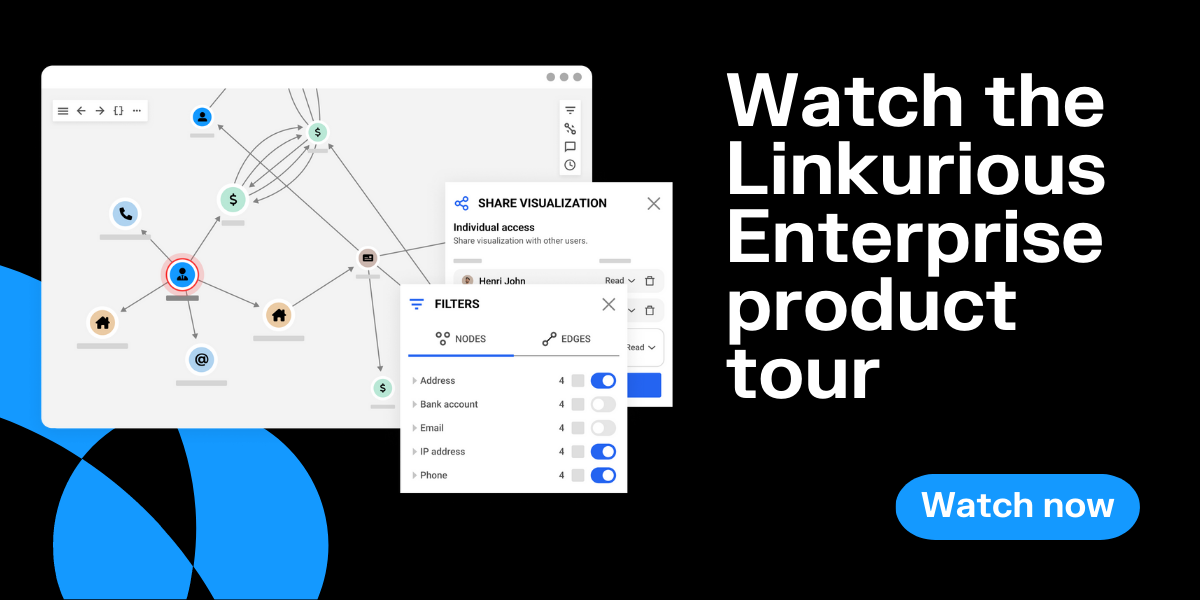
Linkurious Enterprise is a tool that helps organizations move from traditional to graph analytics, to detect and investigate threats hidden in complex connected datasets. This graph analytics and visualization solution provides both technical and non-technical users with a deep understanding of relationships and context to drive better decision making.
Linkurious Enterprise lets you visualize and analyze your graph data in real time. It helps you:
- Detect sophisticated threats: the unified graph view of your data reveals suspicious connections and patterns otherwise hidden in silos.
- Accelerate investigations: graph visualization removes the difficulty of tracking information scattered across tools and tables, letting you find hidden insights faster.
The future of graph analytics
Graph analytics is still an emerging technology. But given current business trends, applications of graph will only expand in the future. The use of big data is increasing, and the relationships within that data are growing increasingly complex. There is a greater need than ever for technology that can derive answers and insights from within that complexity. Graph analytics can help ensure success for businesses moving into the future.
According to projections by Gartner, graph technologies will be used in 80% of data and analytics innovations by 2025, up from 10% in 2021, facilitating rapid decision making across enterprises.
About Linkurious and Linkurious Enterprise
Linkurious is a software company providing technical and non technical users alike with the next generation of detection and investigation solutions powered by graph technology. Simply powerful and powerfully simple, Linkurious Enterprise helps more than 3000 data-driven analysts or investigators globally in Global 2000 companies, governmental agencies, and non-profit organizations to swiftly and accurately find insights otherwise hidden in complex connected data so they can make more informed decisions, faster.